E-profile

paysage-eumetnet

Saharan dust outbreak as observed by the E-PROFILE network

0 Comments

av-small


Click on the image to see the animation showing the dust plume over Europe


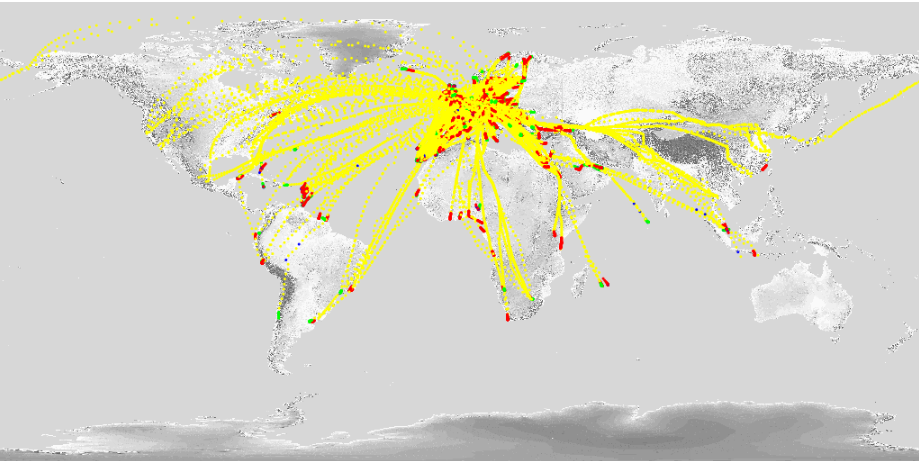
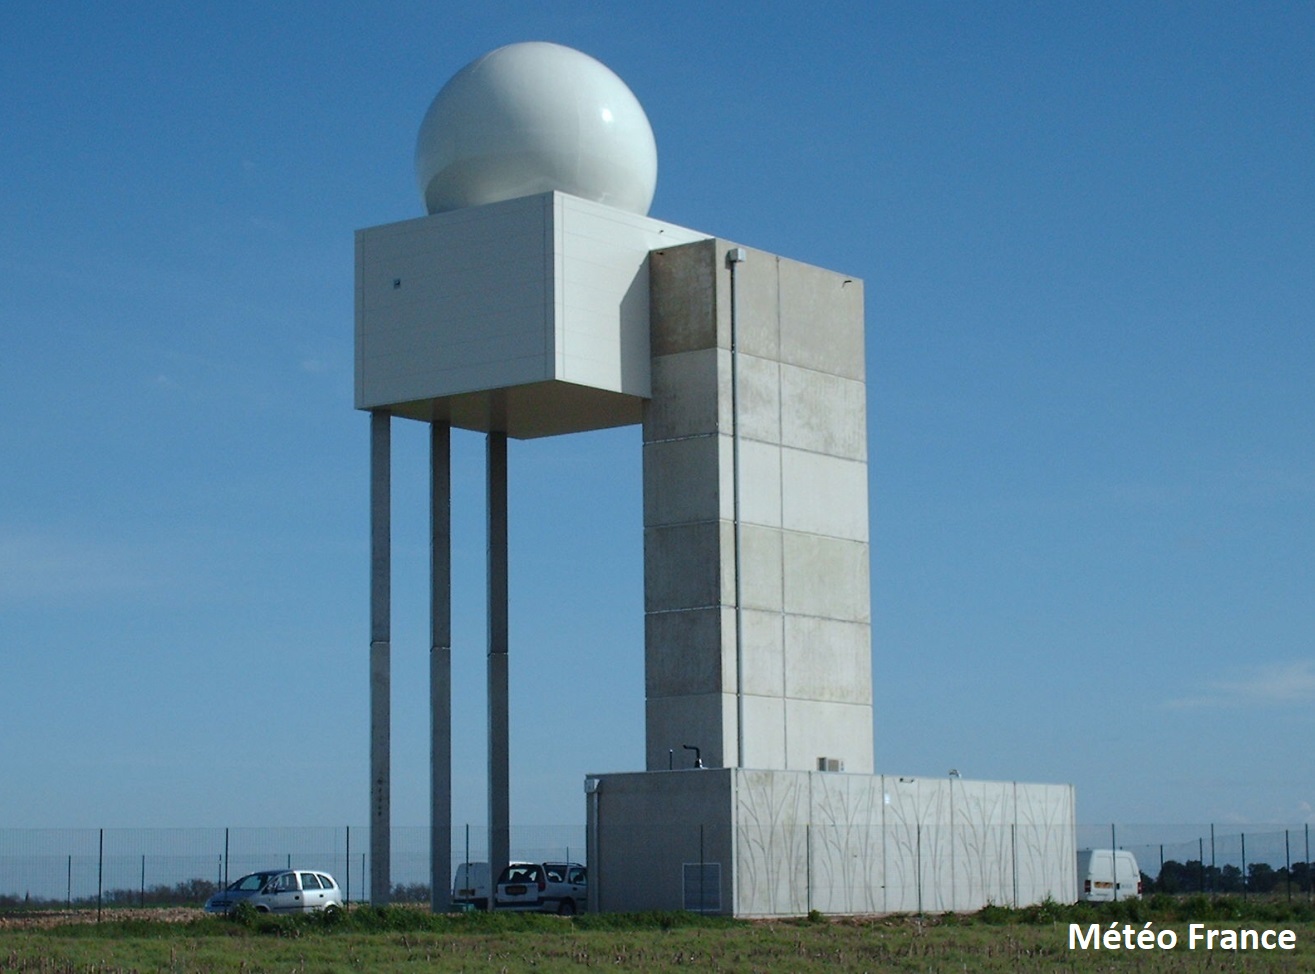
Over the weekend a strong outbreak of Saharan dust affected large regions of Europe and lead to number of photos as seen in Figure 1 with red-coloured skies and dramatically decreased visibility. Such conditions were observed by many ALC’s (Automatic lidars and ceilometers) in the E-PROFILE network, as illustrated in Figure 2. The origin of the air is clearly Saharian as indicated by the back-trajectories in Figure 3.

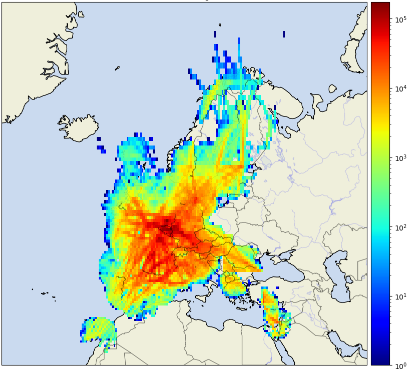
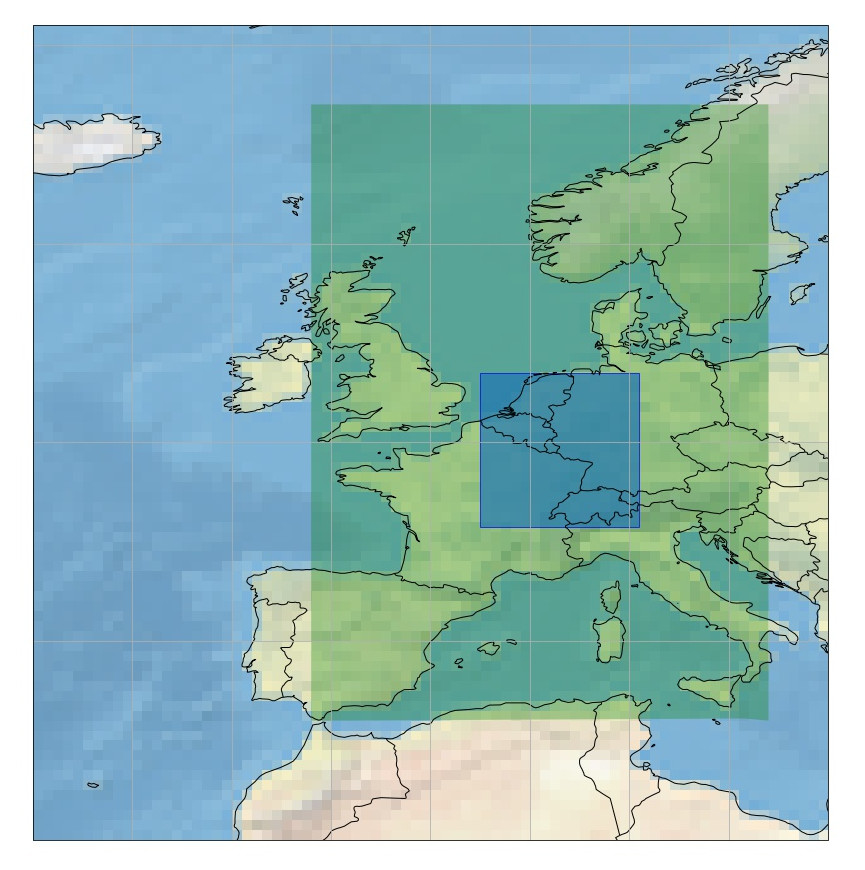
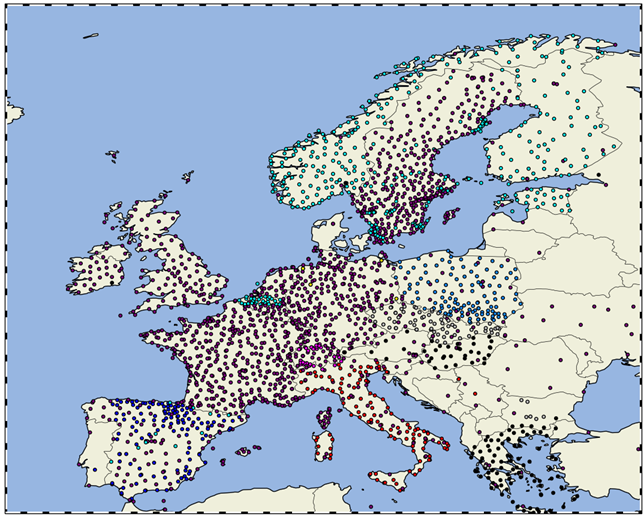
Dense 24/7 networks such as E-PROFILE are an ideal tool to monitor the horizontal, vertical and temporal distribution of aerosols and prove extremely useful to assess the situation in such events. This is illustrated by Figures 4-6 which indicate how the dust plume moved over Europe. It was located over Spain on 05 February before gradually moving towards the North and East during 06 and 07 February. This is a showcase for Saharan dust mixed into the boundary layer, but such a monitoring is possible for any aerosol type at any tropospheric altitude.

av-small

Fig.1 Strong limitation in visibility and atmosphere in reddish colours in the Swiss prealps. Picture taken by Alexander Haefele in the afternoon of 06 February 2021.


av-small

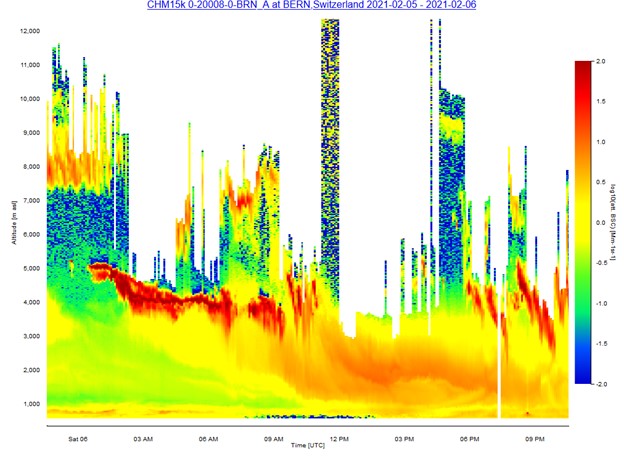
Fig.2 Attenuated back scatter observed on 06 Feb by the E-PROFILE ALC in Bern, Switzerland, in proximity to the location of the picture in Figure 1. A massive intrusion of Saharan dust reaching the boundary layer in the late morning can be observed.


av-small


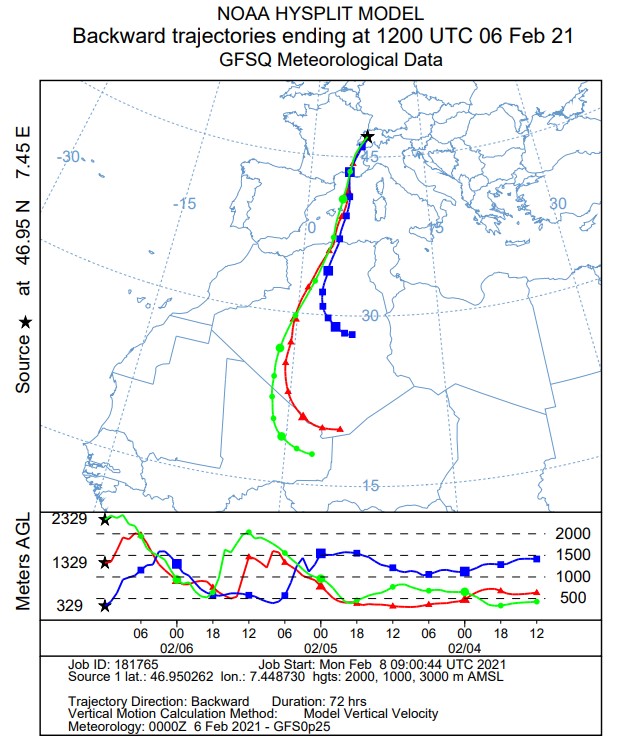
Fig.3 Back-trajectories arriving in Bern, Switzerland on 06 Feb 12:00 for different altitudes. They clearly indicate the Saharan origin of the airmass. Data from HYSPLIT accessible at www.ready.noaa.gov.


av-small


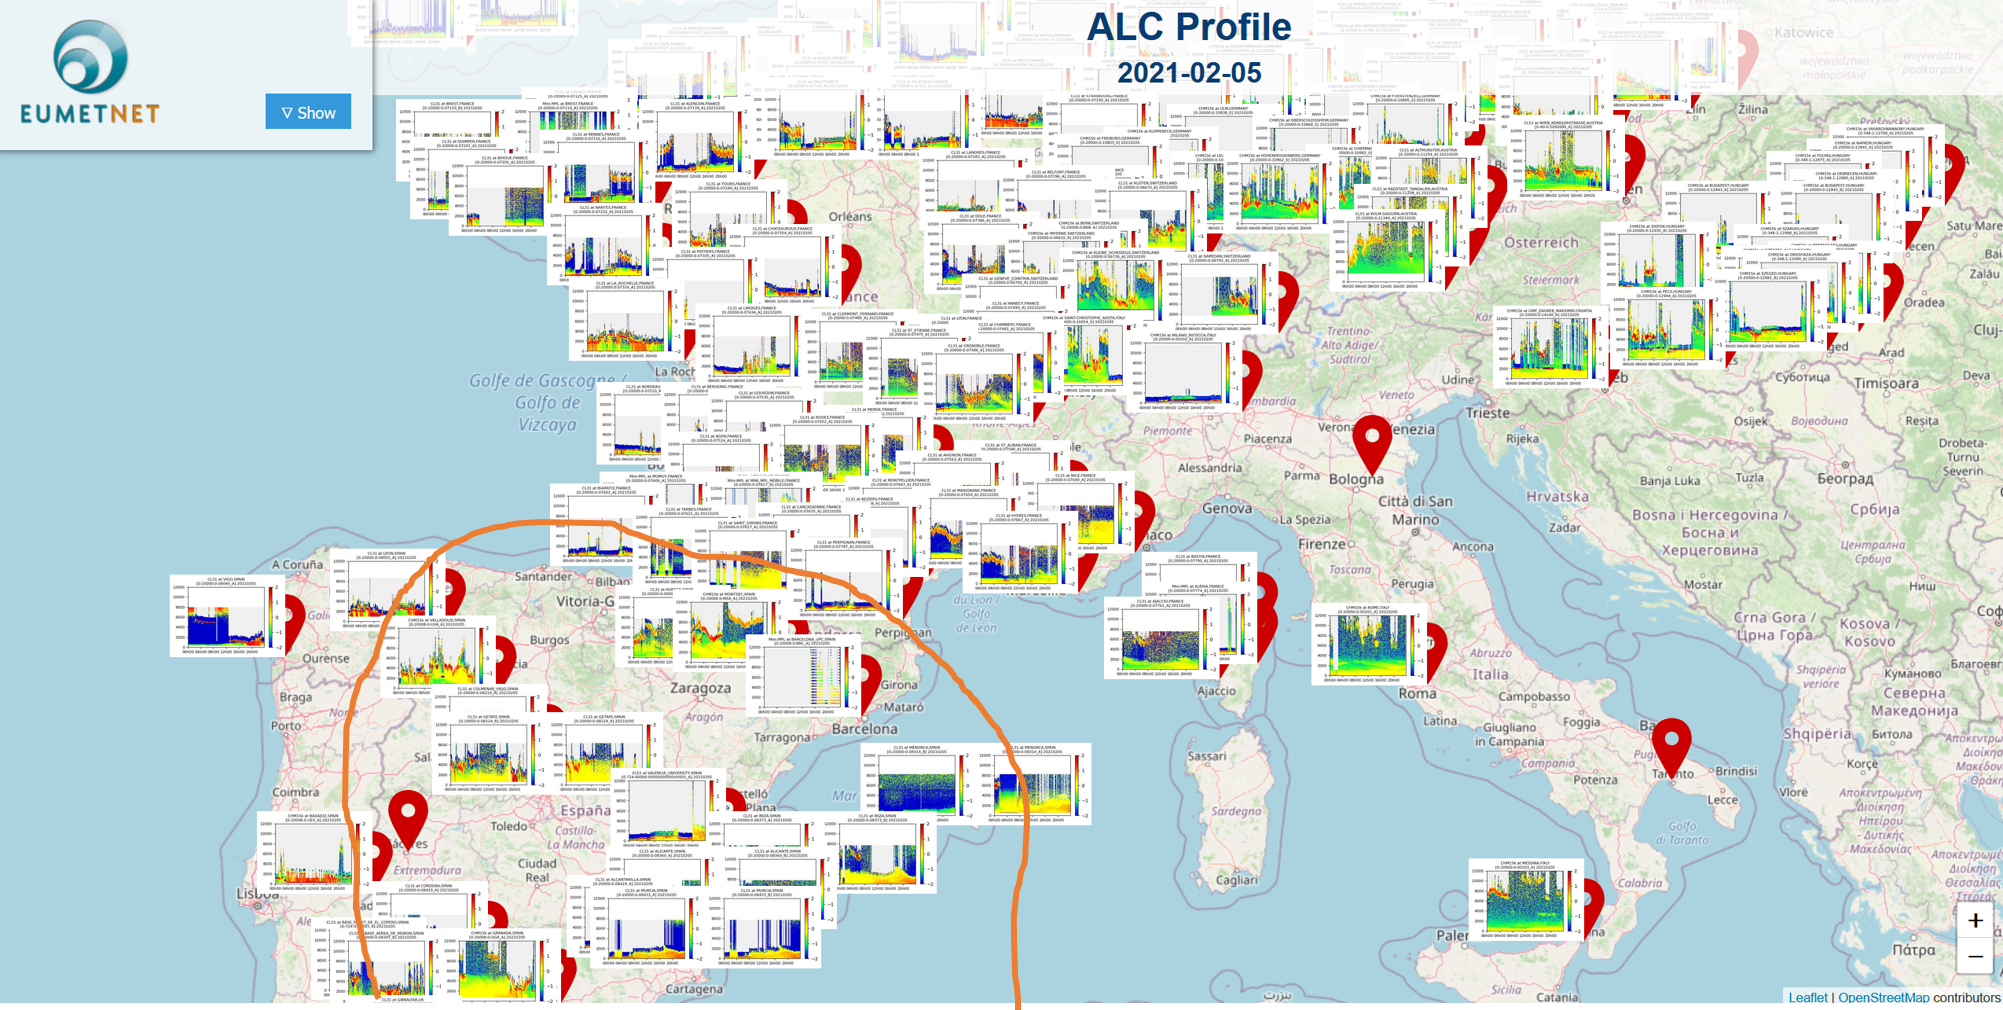
Fig.4 Overview of attenuated backscatter profiles observed on 05 Feb at several central-European stations. The area delimited by the orange line denotes the area where high dust concentrations were observed. Interactive view at: https://e-profile.eu/#/?currentView=CMProfile&measurementDate=2021-02-05&QLSize=70


av-small

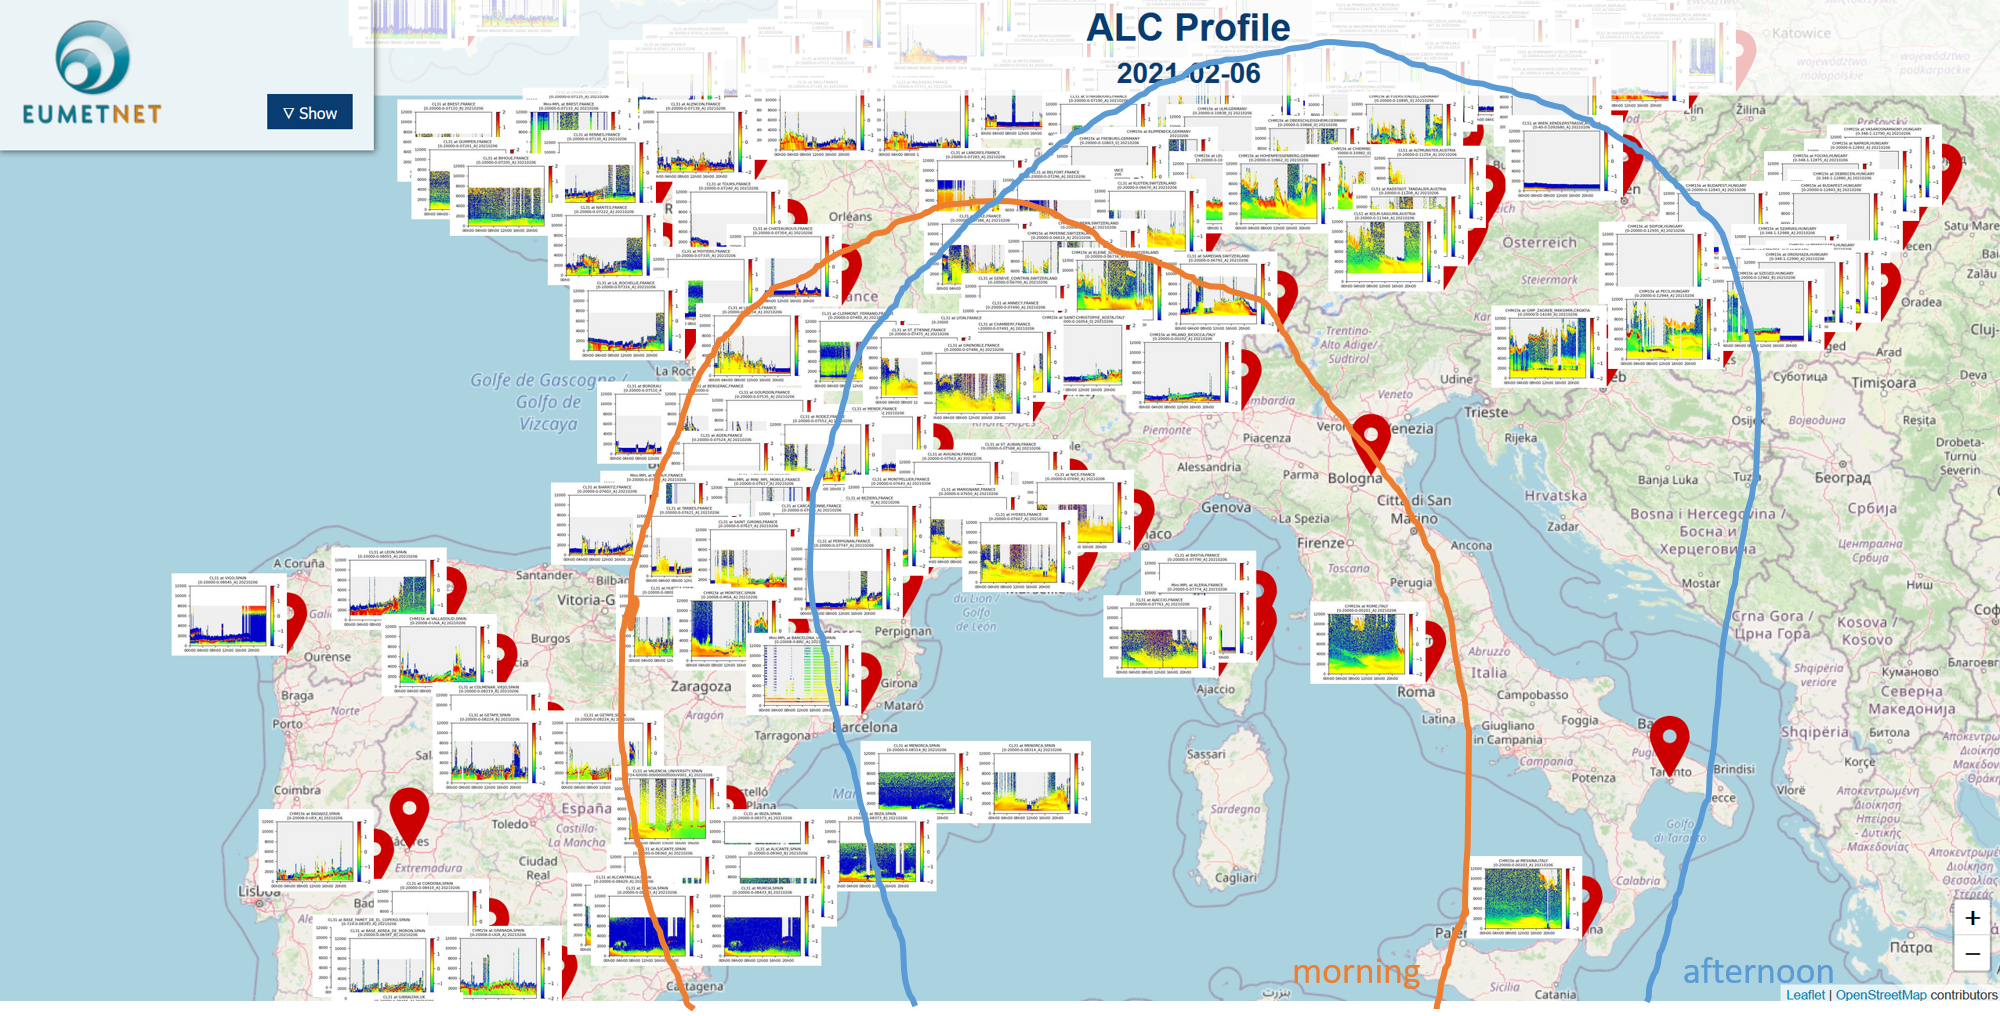
Fig. 5: Overview of attenuated backscatter profiles observed on 06 Feb at several central-European stations The area delimited by the orange and blue lines denote the area where high dust concentrations were observed during the morning and the afternoon, respectively. Interactive view at: https://e-profile.eu/#/?currentView=CMProfile&measurementDate=2021-02-06&QLSize=70


av-small


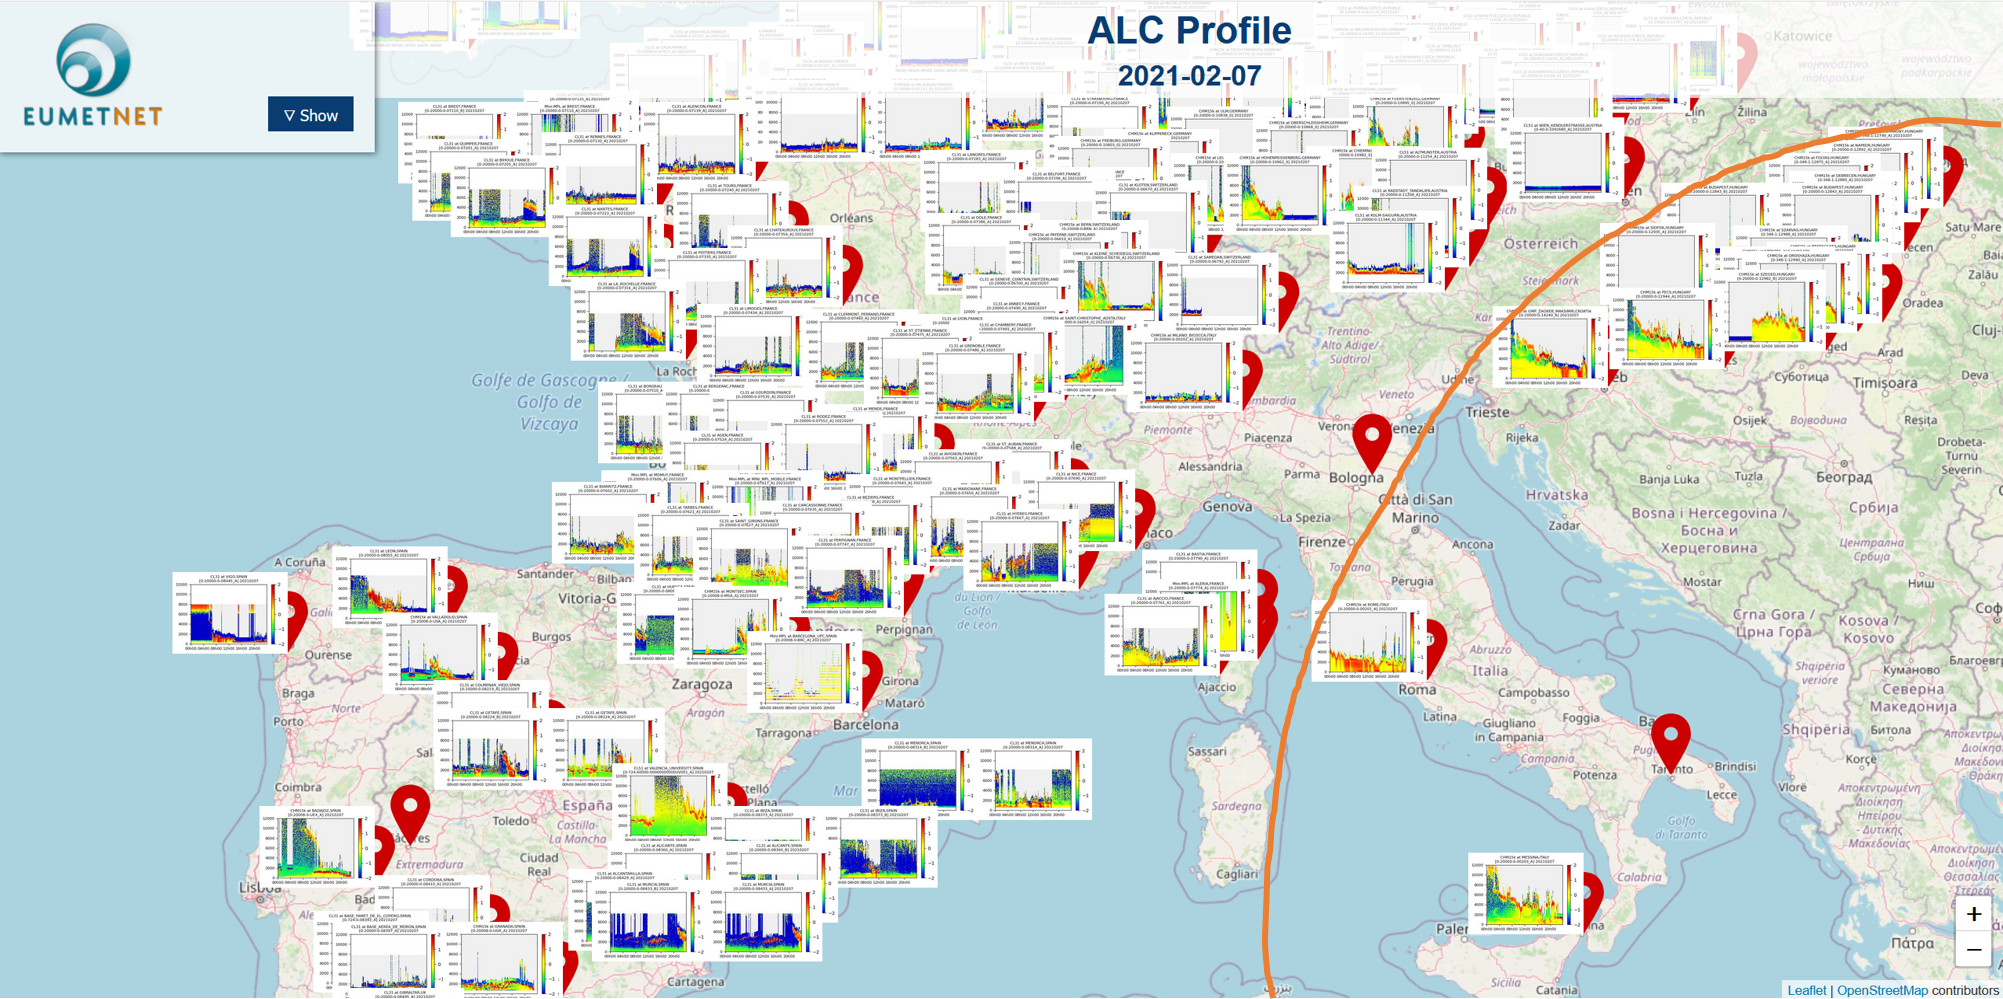
Fig. 6: Overview of attenuated backscatter profiles observed on 07 Feb at several central-European stations. The area delimited by the orange line denotes the area where high dust concentrations were observed. Interactive view at: https://e-profile.eu/#/?currentView=CMProfile&measurementDate=2021-02-07&QLSize=70


av-small

More images of the phenomenon in the Swiss Alps near Grand Saint-Bernard

av-small

Radar Wind profilers

0 Comments

RADAR WIND PROFILERS

Radar wind profilers are continuously providing wind profile observations, independent of weather conditions. The wind profiler network is complemented by wind measurements from precipitation radars during rain and snowfall.

E-PROFILE operates a centralised data hub near real-time data collection and processing. The measured data are distributed as NetCDF via FTP and as BUFR over the GTS for assimilation by the leading numerical weather prediction centres.


Data visualisation is available on the E-PROFILE webpage: Profile view and Plan view


Terms and Conditions of the EUMETNET website

Programme Management

0 Comments

OBSERVATIONS – PROGRAMME MANAGEMENT

Objectives

The objectives of the EUMETNET Observations Programme Management are:

– To design and coordinate the evolution of the ground based EUMETNET Composite Observing System (EUCOS) to be optimized on a European scale with a view to improving short range forecasting and climate monitoring over Europe without increasing the overall cost, in line with the EUMETNET Strategy defined by the Assembly;

– To monitor and control EUCOS performance;

– To ensure effective management for the fully integrated components E-ABO, E-ASAP, E-GVAP, E-PROFILE,  E-SURFMAR and OPERA;

– To support Member State activities to design, coordinate and operate networks to support general forecasting, including kilometre-scale NWP, and climate monitoring and to facilitating international collaboration (e.g. through the facilitation of information exchange and multi-lateral discussions);

– To provide representation on observational matters on behalf of and supporting the interests of EUMETNET Members within international fora including those relating to WMO and GMES;

– To support the evolution of European and national network design through a studies programme.

  • "optimisation of EUCOS on a European scale"

The tasks

– Organising two meetings a year with the Operational Service Managers and Project Managers of the Observations Programme,

– Coordinating activities, monitoring progress, work plans, requirements tracker, risk register etc.

– Produce common Observations Programme mid-year reports to STAC, PFAC and Assembly.

– Work with the EUMETNET Secretariat to ensure that the programme budget proposals for the Observations Programme and integrated Operational Services are delivered in line with the EUMETNET EIG budget and business planning cycle in the Financial Rules.


The requirements

Coordinate the Observation Programme and the Observation Operational Services and Projects according to the tasks given in the programme decisions of the individual services and projects by:

– Identify issues and prepare supporting information for decisions within the Observations programme that have to be referred to STAC and/or PFAC.

– Prepare statements on proposals for new operational services, projects or activities within the Programme.

– Represent EUMETNET at meetings of the Observation Programme Managers.

– Represent EUMETNET at international Conferences/Meetings.

– Represent the Observation Programme at STAC, PFAC and /or Assembly, if necessary.

– Coordinate and lead strategic roadmap development in the Observations Programme.

– Interact with and ‘light’ coordination of STAC Working Group activities (example: WG-INS). Usually those WGs should work independently.

– End of Phase reviews of Observation Programme.

The organisation

The current phase of the Programme started in January 2019 and will last until the end of 2023.The Coordinating Member is the UK Met Office. The Programme Manager is Jacqueline Sugier. The Observations Programme Management Team is comprised of three staff members.

The Observations Programme Management Team is advised by the Observations Programme Advisory Group and the Observations Scientific Expert Team.

The overall structure of the Obs Programme can be found here.

More information

Eucos

EUCOS is the ground-based or non-satellite observing system designed for EUMETNET Members to serve the needs of the EUMETNET Forecasting (incl. general numerical weather prediction) and Climate Programmes and those of the Members over Europe.

Data is provided from several observing networks of all National Meteorological (and Hydrological) Services (NMHS) participating in EUMETNET. The data are collected within the EUCOS area 10°N – 90°N, 70°W – 40°E.

The EUMETNET Observations Programme Management Team is responsible for the EUCOS co-ordination. One of the main deliverables is to provide statistics summarising the performance of each component of the network, which now comprises of:

– All European ASAP ships (ASAP = Automated Shipboard Aerological Programme)
– All European AMDAR aircraft (AMDAR = Aircraft Meteorological Data Relay Programme)
– Selected European radiosonde stations
– Selected surface synoptic stations
– European VOS ships (VOS = Voluntary Observing Ships)
– Selected moored and drifting buoys
– Selected European wind profilers and weather radars
– Selected GNSS sites providing GPS delay and water vapour measurements.

The co-ordination of the data acquisition is on the one hand within the responsibility of the Observations Programme Management Team – such as the co-ordination of the surface synoptic stations and the radiosonde stations. On the other hand the Observations Programme Management Team is supported by programme components which are co-ordinated by Operational Service Managers or Project Managers. The operational services and projects are:

– E-AMDAR (data acquisition from AMDAR aircraft)
– E-ASAP (data acquisition from ASAP ships)
– E-GVAP (data acquisition of European GPS delay and water vapour measurements)
– E-PROFILE (data acquisition from European wind profilers and weather radars and work on establishing a data exchange of Lidar/Ceilometer measurements for the purpose of volcanic ash monitoring)
– E-SURFMAR (data acquisition from European VOS ships and buoys)
– OPERA (data acquisition of European weather radar data to provide European weather radar composite products).

Studies Programme

The operational part of the Observations Programme will be steadily improved by considering experience gained from operations and specifically by taking into account the results of a dedicated studies programme. Changes in networks should be based on scientific analyses and therefore the EUMETNET Observations Programme launched several data impact studies in the past. A selection of completed studies is briefly described on the bottom of this page.
Data impact studies usually comprise of a set of observing system experiments (OSE) or similar NWP experiments which are run to assess the impact of different observing systems on NWP forecast skill. NWP groups of NMHSs or ECMWF conduct the studies and the Observations Programme works as an interface between data users and providers.
Eventually recommendations are derived from the data impact studies which shall give guidance on how to (re)design the EUCOS in order to better meet the user requirements.

Planned studies in the Programme phase 2013-2018

In the current programme phase new findings from recently developed ‘Forecast Sensitivity to Observations Impacts’ (FSOI) tools or classical Observing System Experiments (OSEs) will help to define the contributions made by the various components of the terrestrial composite observing system. It will also be vital to take into account the increasingly important contribution made by the space segment, therefore the EUCOS network must be designed to best complement the operational space segment, and this should be an ongoing process.

·       The study on the impact of humidity observations reported from aircraft is one of the major issues to cope with in the current programme phase. In parallel a general FSO study which shall assess the impact of all EUCOS networks will be prepared. Outcomes of this study will be the basis for any EUCOS redesign considerations.

·       Taking into account especially results from the second Space-Terrestrial Study a new set of scenarios for OSEs will be proposed, which shall help to determine the impact of 10 and 20% reductions or increases in the budgets of the expensive ground-based observing platforms: E-AMDAR, E-ASAP and national radiosonde networks.

·       Taking into account that EUMETNET is going to significantly increase its efforts to create high quality Radar data and products via its OPERA programme, a first combined FSO/OSE impact study for kilometre-scale models will be initiated which will look into the impact of spatially and temporarily highly resolved observations like Radar observations. Special emphasis will also be given to other observing platforms with high temporal resolution like wind profilers, E-GVAP and E-AMDAR.

Selection of Studies of the Programme phase 2007-2012

Space Terrestrial Study

A joint study between EUCOS, EUMETSAT, ECMWF and a number of NMHSs had been conducted in 2006/2007 to better understand the impact of the various components of the full space-based and terrestrial observing system on the performance of regional NWP in the 1 to 6 day forecast range.

Forecast Error Contribution for different observing types; copied from 2nd Space Terrestrial Study ECMWF Final Report.

Upper-Air Network Redesign study

The main objective for the Upper-Air Network Redesign study was the definition of a European-wide network of ground-based upper-air observing systems whose configuration and setting is based on scientific analyses. The S-T study had shown that despite of all the additional new satellite observations, the degrading of the current terrestrial observing system to a basic network would have a significant negative impact on the forecast skill.


Horizontal distribution and vertical histogram (relative frequency) of European AMDAR profiles below flight level as used in baseline scenario in a typical 4DVAR window; copied from Upper-Air Network Redesign Observing System Experiment ECMWF Final Report

Data Targeting System (DTS)

The aim of data targeting is to deliver additional observations when and where they will be most beneficial to subsequent forecasts. The locations, “sensitive areas”, will vary from day to day and the supplementary observations will be most valuable if they help reduce uncertainty in cases of potential high-impact weather. A full trial of the DTS took place three times. For the EURORISK/PREVIEW project between February and December 2008, for the DTS-MEDEX-2009 campaign between September and December 2009 and for the HyMeX campaign between September and November 2012. Extra observations were requested from available E-AMDAR (commercial aircraft), E-ASAP (ships) and EUMETNET Members’ radiosonde stations in the target areas. All additional observations were available on the GTS and could be used in forecast models.

Example of ECMWF DTS Extra Observations Proposal for 05/10/2008

Programme Evolution

The EUCOS Operational Programme was established on 1st January 2002, based on recommendations resulting from the EUCOS Implementation Programme managed by Météo-France, which started in 1999 and ended on 31st December 2001. It aimed to establish and operate a truly European observing network under the auspices of the European Meteorological Network (EUMETNET), to deliver increased efficiency, leading to better-quality numerical and general forecasts, initially on a European scale.

EUCOS Operational Programme 2001-2006
Since 2002 the EUMETNET Composite Observing System (EUCOS) was being developed from the planning phase to an operational programme as an integrated terrestrial observing system for Europe serving the needs of regional numerical weather prediction. EUCOS has evolved rapidly by active co-operation and support of all the members of EUMETNET. In the period 2002 till 2006 the UK Met Office was responsible member of the EUCOS Operational Programme.
2002 saw the establishment of EUCOS as an ‘operational’ network with agreed performance standards, fault reporting and change control mechanisms. Monitoring of overall network performance began in earnest in 2003 and quickly revealed areas for improvement. At the same time major parts of the Studies Programme were implemented including:

  • the High Frequency AMDAR trial (HF AMDAR)
  • the Atlantic THORPEX Regional Campaign (A-TREC)


The first study confirmed the surfeit of upper air data across central Europe and indicated that benefits from sub 3 hourly sampled AMDAR profiles would only be obtained in the more outlying, data sparse zones such as northern Scandinavia, the Mediterranean and the Iberian Peninsula.

The second study was designed to help address the definition of a targeted observations programme for Europe to improve regional NWP skill, especially concerning high impact weather events. Small positive impacts on forecast quality were generally obtained but it was clear that further research effort is needed to fully define a targeted terrestrial observing system. This work continued under the EU GMES EURORISK-PREVIEW Programme in which EUCOS was responsible for developing improved methodologies for meteorological observations targeting and conducting a demonstration of capability in 2008.

The E-SURFMAR programme was established during 2003 as an optional element supported by 15 countries on the basis of a detailed programme proposal. This was followed by a comprehensive design study which was accepted at the autumn 2004 EUMETNET Council meeting. The E-SURFMAR Programme has seen significant reorganisation in the management of marine observing programmes within Europe.

EUCOS Operational Programme 2007-2011 (prolonged to 2012)


The EUMETNET Composite Observing System (EUCOS) has been developed as a comprehensive and integrated terrestrial observing system for Europe serving the needs of regional numerical weather prediction (NWP). Already in the programme phase 2002-2006 it was clear that in the long term the remit of the programme may be extended to other application areas such as short range forecasting, nowcasting or even climate monitoring, but for the programme phase 2007-2012 the focus remained on meeting the needs of regional NWP.

The discussion planning the programme phase 2007-2012 for EUCOS started at the specially convened PB-OBS workshop in Dublin, November 2004. Given the fact that results from the Studies Programme were not available before mid 2007, a two stage approach was accepted for the programme 2007-2012. In order to achieve the programmatic targets set in, this programme phase was split into two parts.

In January 2007 the Deutscher Wetterdienst (DWD) took over the responsibility of the EUCOS Programme Management. To achieve the programmatic targets it was furthermore necessary to develop the EUCOS infrastructure by:

  • operating and improving the EUCOS information system;
  • revising quality monitoring requirements and improving the reliability of some of the existing important radiosonde and surface synoptic stations in co-operation with the national contact points;
  • delivering a timely flow of EUCOS funds from participants to the various components of the programme.


Within the programme phase 2007-2012 DWD launched and operated a new EUCOS Quality Monitoring Portal (QMP) and initiated and monitored scientific studies like the ‘Upper-Air Network Redesign Study’ or the ‘2nd Space-Terrestrial Study’. In collaboration with the programme component E-AMDAR the addition of humidity measurements on AMDAR aircraft was initiated with high priority. A second space terrestrial study investigating the benefit of the expected additional satellite data from METOP and the improvements in data assimilation schemes has also been initiated by the EUCOS Team. Further the EUCOS Team continued to operationally integrate data from WINPROF, OPERA-III and E-GVAP and the requirements for a central data hub with high availability were exploited.

Due to the transition of EUMETNET into the new legal body ‘EIG EUMETNET’ the operational EUCOS Programme phase was prolonged to 2012.

In the period 2010-2012 the EUCOS Team contributed to the evolution of the EUMETNET Observation capability area by proposing new activities or by supporting the development of the EUMETNET Observations Roadmap 2012-2020. Thereby the EUCOS Team responded to the growing interest of Members to include requirements from many different data users (e.g. general NWP, Climate and Nowcasting), to extend the remit of the programme beyond regional NWP and to show benefits for the Members. The EUCOS Team led the drafting of the Observation Requirements for the new programme phase 2013-2017 on which the call for tenders for the next programme phase 2013-2017 was based.

DWD successfully applied again to be Coordinating Member of the current Observations Programme phase 2013-2017 (prolonged to 2018).

Quality Monitoring

One of the major tasks of the Observations Programme Management Team is to ensure the delivery of quality assured data by operating several web-based automated tools to monitor the performance of the EUCOS networks and to perform active quality control of the EUCOS and Members’ observing networks by regularly monitoring of data availability, timeliness and accuracy.

Following defined fault recognition and escalation procedures the Observations Programme Management Team raises fault reports in case of failures or outages of observing systems, contacts national focal points or Operational Service/Project Managers and coordinates tasks to solve the issues. Further the Observations Programme Management Team provides quarterly and annual reports on quality monitoring issues for all EUCOS networks.

The performances of designated EUCOS stations are compared against targets on data availability, timeliness and accuracy defined in the ‘EUCOS Performance Standards’. These Performance Standards have to be revised in order to take into account new requirements of EUMETNET’s Forecasting and Climate Programmes and new emerging needs from NWP in the programme phase 2013-2018.

Initial integration of GUAN and GSN station lists into the existing EUMETNET EUCOS RA VI Quality Monitoring Portal and associated procedures and programmes.

In coordination with the GCOS Network Manager the station lists of GUAN and GSN stations to be monitored in the EUMETNET RA VI Quality Monitoring Portal were defined in summer 2015. To distinguish between the quality monitoring statistics of Regional Association VI (Europe) and the global GCOS quality monitoring a selection function was implemented to allow the users to select the area / network of interest. Furthermore it was decided to rename the RA VI QMP into ‘WMO Quality Monitoring Portal’. The release of the new WMO Quality Monitoring Portal containing the GCOS quality monitoring statistics went online under https://eucos.dwd.de on 9th November 2015. Thus, the initial integration of GUAN and GSN stations into the quality monitoring portals operated by EUMETNET was finalized end of 2015 and quality monitoring statistics are available back to July 2015 at present.


Radiosonde Stations

The EUCOS territorial segment comprises of selected radiosonde and surface stations operated by members. The EUCOS upper-air network includes those radiosonde stations necessary to meet the requirements of Regional NWP over Europe. Results from the EUCOS studies of the programme phase 2002-2006 have led to a network comprising of 50 stations, data from which should be complemented by approximately 750 AMDAR profiles per day by 2006. Following the recommendations of the Upper-Air Network Redesign Study the EUCOS upper-air network has been revised in 2010 and consists of 93 stations since then.

The Observations Programme Management Team monitors the performance of the designated EUCOS radiosonde stations on a regular basis and contacts the operating Members in case of failures and outages. Within the current programme phase the EUCOS radiosonde station network might be revised according to new user requirements from km-scale modelling, nowcasting and climate monitoring.

Surface Land Stations

The EUCOS territorial segment comprises of selected radiosonde and surface stations operated by members. The EUCOS surface land station network comprised of 210 manual and automatic stations since 2006 satisfying the main user requirements from general forecasting and NWP. The central monitoring of the EUCOS surface land stations aims at improving data quality, network reliability, and data timeliness. An evenly-spaced network has been selected with an average spacing of not more than 250 km. Priority has been given to stations collocated with EUCOS upper-air sites, and additional surface stations were selected around the Alps and Pyrenees as well as Azores, Canary Islands, Iceland and Greenland.

In 2010 the EUCOS surface land station network has been updated to close gaps within the network and to allow the new member countries Croatia, Estonia, Slovenia, Poland and Serbia to introduce surface land stations to the EUCOS network. It was agreed in 2009 to harmonize the EUCOS surface land station network with the requirements of climatology. At its meeting in March 2010, the ECSN (European Climate Support Network) Advisory Committee (EAC) has developed a roadmap for embedding climate requirements into the EUCOS surface land station network. EAC has set up a working group to develop the design of ESCLSN, the EUCOS surface climate land station network in cooperation with the EUCOS Team.

The Observations Programme Management Team monitors the performance of the designated EUCOS surface land stations on a regular basis and contacts the operating Members in case of failures and outages.

Within the current programme phase the EUCOS surface land station network might be revised according to new user requirements from km-scale modelling, nowcasting and climate monitoring. The updated EUCOS surface land station network 2013 consists of 268 synoptic stations (see map below).

E-GVAP

0 Comments

OBSERVATIONS – E-GVAP

Objectives

The purpose of E-GVAP is to provide for EUMETNET members ground-based GNSS (Global Navigation Satellite System) Zenith Total Delay (ZTD) estimates in near real-time (NRT) for use in operational meteorology.  As ZTD is sensitive to water vapour E-GVAP provides additional water vapour information to weather models and meteorologists in Europe and beyond.  That´s important, since water vapour is a key constituent in many weather phenomena, and varies strongly in both space and time. Water vapour is “under observed”. E-GVAP is helping to fill that gap.

  • water vapour data from Navigation Satellite Systems

The tasks

The main task of E-GVAP is first of all to provide GNSS ZTD data in NRT for usage in operational numerical weather prediction (NWP) models and for usage by forecasters.

Secondly E-GVAP is to expand the GNSS network contributing to meteorology. Mainly as regards inclusion of new regions, but also as regards densification in regions.

Thirdly E-GVAP is to help its members using ground-based GNSS data in their operations, which is done by sharing of results and howto´s from successful users.

Also E-GVAP is to follow the development in ground-based GNSS meteorology, where several new techniques are emerging and gradually maturing, such as estimation and use of ZTD gradients, Slant Total Delays (STDs) and 3D water vapour from tomography. In the future they will lead to much more humidity information from the same number of GNSS receivers.

The requirements

 Requirements are set both with respect to timeliness and precision of the E-GVAP ZTD data.

The EUCOS QMP monitors timeliness and precision of E-GVAP data in a similar fashion to the monitoring of other EUMETNET Obs Programme data.

E-GVAP itself, as well as many of the analysis centres, performs  more detailed monitoring. Part of the E-GVAP monitoring can be seen at http://egvap.dmi.dk select entry “validation”.

Other parts require access to the E-GVAP ftp server.


The organisation

The current programme phase will last to the end of 2023. The Danish Meteorological Institute (DMI) has been the coordinating member since 2005. The programme itself is run in a collaboration between DMI, the UK Met Office and the Royal Dutch Meteorological Office (KNMI). The programme manager is Dr. Henrik Vedel, DMI.

The real base of the programme is a tight collaboration between geodesy and meteorology. The vast majority of the raw GNSS data used E-GVAP come from geodetic institutes and private GNSS companies. The majority of the GNSS data processing is done at geodetic institutions and universities, but also at a few met offices.  

As several members run global weather models, and there is currently no global organisation of ZTD exchange, some E-GVAP analysis centres process also global GNSS data, and E-GVAP is expanding its collaboration with analysis centres outside Europe.


More information

History & Status

GNSS meteorology explained

Review of the state of the art and future prospects of the ground-based GNSS meteorology in Europe:

www.atmos-meas-tech.net/9/5385/2016/amt-9-5385-2016.pdf

(to be completed)

Participating GNSS analysis centres

E-ABO

0 Comments

OBSERVATIONS – E-ABO

Aim

The main aim of the EUMETNET-ABO (Aircraft Based Observations) Operational Service is to fulfil the requirements of the EUCOS Operational Programme for measurements of high quality upper air meteorological variables from aircraft.

  • "measuring high quality upper air meteorological variables from aircraft"

Objectives

The continued, sustainable access to high quality upper air observations of temperature, wind speed and direction (and humidity where possible) from commercial aircraft.

Improved uniformity of coverage of airports providing 3-hourly profile observations across the EUCOS domain.

Ensuring the monitoring and reporting of individual network performance to enable the effective combination of the different data sources into one, efficient observing network.

Implementing new capabilities to enable more aircraft based observations to be produced within a reduced data budget.

Continuously seeking to introduce efficiencies via targeted use of cost-effective data sources or transmission methods.

Deliver quality-controlled aircraft-derived data from Mode-S EHS/ADS-B via the EMADDC operated as a service to the EUMETNET community by KNMI.

Flexibility to facilitate the provision of additional data required by individual NMHSs.

Organisation

The current 5-year phase of the E-ABO programme began on 1st January 2024 with the Met Office as the Coordinating Member, working in partnership with KNMI and DWD. KNMI operate the EMADDC for the provision of aircraft derived data from ADS-B/MODE-S EHS data and DWD manage the AMDAR data optimisation and humidity contracts. 

Programme Manager: Martyn Sunter, Met Office

Technical Coordinator:  David Snook, Met Office

More information

Data & Infrastructures

AMDAR
E-AMDAR is EUMETNETs contribution to the World Meteorological Organization (WMO) Aircraft Meteorological Data Relay (AMDAR) observing system. E-AMDAR facilitates the fully automated collection and transmission of weather observations from commercial aircraft. The E-AMDAR programme is an integrated component of the WMO Global Observing System (GOS) of the World Weather Watch (WWW) Programme . The system is operated by EUMETNET Member NMHS in collaboration and cooperation with partner airlines. Onboard sensors, computers and communications systems collect, process, format and transmit the weather data to ground stations via satellite and VHF radio links. The transmission of this data is most often performed by the aircraft’s ACARS (Aircraft Communications Addressing and Reporting System) system. Once on the ground, the data is then relayed to the global network of national meteorological services and other authorised users.

EMADDC

Modern aircraft carry sensors to measure the Mach number (using a pitot static probe) and air temperature. An enhanced surveillance (EHS) air traffic control radar interrogates all aircraft in sight in a selective mode (Mode-S), on which the aircraft replies with a message containing, for example, magnetic heading, airspeed and Mach number. These messages can be collected by Air Traffic Control or by a network of local receivers. The EMADDC use these messages to derive tens of millions of wind and air temperature observations in Europe.  

AIREPS, ADS-C, TAMDAR and AFIRS

Additional aircraft based observations are received from AIREPS and ADS-C messages. Third-party data known as TAMDAR and AFIRS AMDAR complement the other networks.


History

The first meteorological data from aircraft were collected in the early 1900s. Following development of the concept for transmitting aircraft temperature and wind information to the ground in real-time by the Australian Bureau of Meteorology in the 1980’s, European National Met Services (NMHS) started developing their own Aircraft Meteorological Data Relay (AMDAR) Programmes with their national airlines. Each NMHS was then responsible for providing this data to the GTS.

Initial airlines and start dates:

KLM (1993)
Air France (1995)
British Airways (1998)
SAS (1998)
Lufthansa (1999)

Met Office (UK) developed an automated data processing system to handle British Airways data and so the opportunity arose to provide a single processing system for all European AMDAR data.

There are now 15 airlines participating in the E-ABO AMDAR programme and more than 1000 planes providing meteorological data.

Wind and temperature observations derived from ADS-B/MODE-S EHS messages has enhanced the coverage of aircraft based observations over Europe in recent years and is now centralised through the creation of the European Meteorological Derived Data Centre (EMADDC).


E-SURFMAR

0 Comments

OBSERVATIONS – E-SURFMAR

Objectives

Coordinate, optimize, and progressively integrate European activities for surface observations over the sea in support of Numerical Weather Prediction and climate.

  • "Surface marine observations globally account for 3.5% of the total error reduction on Day 1 forecasts achieved by all types of observation ingested in real-time by NWP models*."

The tasks

– Surface drifter operations
– Data buoys coordination
– Automated VOS coordination and development
– Conventional VOS coordination and development
– Marine data processing
– Quality assurance
– Capacity building and knowledge transfer
– Management

The requirements

– Maintain an operational network of drifting buoys measuring air pressure and sea surface temperature in the North Atlantic, Tropical Atlantic, and Arctic, with data made available in real time onto the Global Telecommunication System of WMO, and reach a sustained network size of 150 operating units.
– Support financially and technically the moored buoys operated by programme participants or national partners.
– Support the activities of Voluntary Observing Ships (VOS) through technical developments, better coordination and harmonisation of practices, and compensation of participating members for the observations and the communications related to this component.

The organisation

The Coordinating Member for this optional programme is Météo-France and its Manager is Paul Poli. Météo-France delivers the programme in partnership with KNMI.

An Expert Team is organized within the programme, bringing together international participants. Their roles include formulating recommendations, assigning priorities, tackling common issues, arbitrating between development options.

Work on data quality is supported by a dedicated web resource: http://esurfmar.meteo.fr/qctools/


*Estimates are based on ECMWF Operations observation feedback for all observations assimilated between May 2015 and June 2016, considering the first day of each month.

More information

History & Status

History

The Operational Service was established during 2003 as an optional element of the EUMETNET Observation Programme (previously called EUCOS), on the basis of a detailed Operational Service proposal.

Supported by 15 countries, it had been initially defined with a period of four years divided into two stages of two years each under the responsibility of Meteo France-France. During stage 1 (2003-2004), a comprehensive design study was carried out and given to the EUMETNET Council. This study was accepted by the EUMETNET Council in September 2004. Stage 2 (2005-2006) mainly consisted in the implementation of the designed network.

In 2006, the Council renewed its confidence in Meteo France to manage the Operational Service during its next phase (2007-2011). Like other Operational Services, this phase was extended to one year (2012).

In November 2012, the EUMETNET EIG Assembly decided to continue the E-SURFMAR Operational Service for 5 years from the 1st January 2013 to the 31st December 2017, under the responsibility of Meteo-France, and the programme was extended for another year, until 31st December 2018.

In November 2018, the EUMETNET EIG Assembly decided that E-SURFMAR continues as an Optional Programme, to be delivered by Météo-France and KNMI.

Since its creation, the E-SURFMAR Operational Service has seen significant reorganisation in the management of marine observing programmes within Europe:

– the COSNA group (Composite Observing System for the North Atlantic) was disbanded in August 2003;

– a VOS Technical Advisory Group (VOS-TAG) was established in September 2003. Before its forming, no forum or organisation actually existed in Europe to co-ordinate technical and operational strategies for European voluntary observing ships;

– the European Group on Ocean Stations (EGOS) reformed as the Data Buoy Technical Advisory Group (DB-TAG) of the E-SURFMAR Operational Service in January 2005. A Data Buoy manager was appointed by the EUMETNET Council (Meteo France responsibility);

– an integrated fleet of AWS which served to develop the AWS technology and demonstrate its operational readiness.

The initial E-SURFMAR design study was driven by the main EUCOS aim: to improve the quality of numerical and general forecasts over Europe. It showed that the most suitable parameter required by regional Numerical Weather Prediction (NWP) which cannot be provided by the space segment, is air pressure.
The recommendation was to increase the density of observations for this parameter as a matter of priority. It also showed that this could be achieved through the use of more drifting buoys and Voluntary Observing Ships (VOS) reporting hourly data from sensitive areas: in the North Atlantic (north of 35°N) and in the Mediterranean Sea.
Some parameters measured by satellites, such as Sea Surface Temperature (SST), wind and waves, require calibration and validation. However, reliable in situ SST data are already provided by drifting buoys. So, an increase of these platforms would naturally contribute to improve the quality of satellite data calibration for SST.

For wind and waves, the E-SURFMAR design study recommended the use of four existing moored buoys which would be upgraded to provide directional wave spectra and 10-minutes wind data, and possibly being re-located in more suitable positions.

In 2017, the design was revisited, taking into account progress in satellite observation and numerical modeling capabilities, as well as more stringent requirements from the climate community, and a new sets of requirements were approved. The current programme, approved for 2019-2023 was designed to address these requirements.

Achievements

A considerable amount of work was carried out during the first fifteen years of the Operational Service. Results include:

– the direct management of a network of about 100 drifting buoys and 26 Shipborne Automated Weather Stations in an integrated VOS fleet;
– full integration of the former EGOS group activities;
– a significant decrease in costs of observations carried out by automated systems operated by the Operational Service management but also by individual NMSes;
– a significant increase in the volume of observations reported by these systems;
considerable savings on data transmission costs thanks to the use of Iridium and data compression techniques as and when possible;
– improvements in the timeliness of drifting buoy data thanks to the use of Iridium instead of Argos for these platforms;
– the development and the use of a global metadata database for ships, which was adopted by the international community and then transferred under of the Joint Technical Commission for Oceanography and Marine Meteorology (JCOMM) in-situ Observations Programme Support Centre (JCOMMOPS);
– the development of a European Common Shipborne AWS (EUCAWS project);
– the establishment of financial arrangements to compensate national activities that are suitable for the Operational Service;
– co-operations, most of them informal, with third parties: MSC (Canada), Puertos des Estado (Spain), GHRSST group…;
– formal cooperation with NOAA (US);
– the set up of quality control tools available on the Web to monitor all operational surface marine observation networks in the world.

Drifting Buoys

Since mid-2007, between 90 and 105 drifting buoys fully or partially funded by E-SURFMAR were permanently operating. This number significantly decreased in 2011 due to wrong batches of buoys delivered by the two usual manufacturers. The average number of operational buoys was below 75 buoys till mid-2012.

Since, more than 100 E-SURFMAR drifting buoys are permanently operating in the EUMETNET area. In parallel, about 45 non-project buoys in average – from NOAA, Meteo-France, LOCEAN, Marlin -, are operating in the area. E-SURFMAR monitor their data as it does for those funded by the Operational Service.
Drifting buoys are deployed from different harbours thanks to local partners (e.g. Port Meteorological Officers): Charleston, Fos-sur-Mer, Halifax, Helsingborg, Kirkenes, Le Havre, Liverpool, Norfolk, Rotterdam, Reykjavik, Southampton…

The number of drifting buoys equipped with barometers is now increasing thanks to barometer upgrades in cooperation with NOAA, and the network size is expected to reach 150 units by 2020.

European Union Horizon 2020 Research and Innovation

E-SURFMAR takes part in the European Union (EU) Horizon 2020 (H2020) research and innovation programme under grant agreement no. 633211 within the project AtlantOS.

AtlantOS aims to improve and innovate the Atlantic observing by using the Framework of Ocean Observing to obtain an international, more sustainable, more efficient, more integrated, and fit-for-purpose system. AltantOS is a large-scale EU Horizon 2020 research and innovation project that contributes to the Trans-Atlantic Research Alliance and GEO.

The participation of E-SURFMAR in this project is to lead the surface drifter network component. Three axes of enhancement are being explored: enhance the geographical coverage, enrich the variety of variables measured at low cost by drifters, and study whether vertical sampling of the upper ocean layer by drifters would assist in understanding and predictability. In addition, E-SURFMAR is working within this project to improve the general data access and data integration, for all categories of users of surface drifter data.

Started on 1 April 2015, the project ends in March 2019. The EU funding in AtlantOS enabled annual deployment of 13 drifters measuring currents, sea-surface temperature, and atmospheric surface pressure in the Tropical Atlantic. In addition, a prototype drifter to measure sea-surface salinity at an affordable cost was developed by partners.

The work carried out also enabled to identify a patch in the data management of delayed-mode drifter data. An architecture for a surface drifter Global Data Assembly Centre (GDAC) was developed as a result.

Moored Buoys

The operations of four moored buoys have been compensated by the Operational Service since 2007: K-pattern buoys K5, M6 and Lion and SeaWatch buoy Cabo Sillero. The first three are operated by Met Office, Met Eireann – in association with MRI – and Meteo France, respectively. The last one is operated by Puertos del Estado. These buoys were chosen for their theoretical ability to perform accurate wind and wave measurements (spectra). During a long time, Cabo Silleiro was the only buoy to provide directional wave spectra and Lion buoy was only providing omnidirectional spectra. Since mid-2008 and October 2013 respectively, K5 and Lion moored buoys have also been reporting directional wave spectra. M6 does not measure this parameter yet.

In general, the current quality of moored buoy data is among the best we can get from surface marine stations. For instance, the RMS of air pressure differences with model outputs was 0.7 hPa in 2013 for the 4 moored buoys (against 0.6 hPa for drifting buoys, 0.7 hPa for S-AWS and 1.3 hPa for conventional VOS). For wind data, the RMS of differences with model outputs was 2.6 m/s in 2013 (against 3.9 m/s for S-AWS and 4.5 m/s for conventional VOS).

These four buoys are part of national networks which are also monitored by the Operational Service. The aim is here to get, in real time, as many quality observations as possible.

Besides moored buoy networks operated by E-SURFMAR participating members or historical partners (Puertos del Estado and MRI), other networks exists.

The Operational Service seeks for cooperation with the institutes which operate these networks and their closest NMS in order to have their data fed into the GTS in real time. Thus, the Greek Poseidon network, the Portuguese moored buoy network, and moored buoys operated by BSH (Germany), have been fed into the GTS and carefully monitored. The close cooperation between E-SURFMAR and these institutes also allowed to improve the measurements carried out by these buoys which now are close to reach WMO standards.

Observing Ships

In 2013, each month about 370 European conventional VOS reported 270 observations per day in average from the EUMETNET area of interest. This is 20% less observations than in 2002 (for 30% less ships), before E-SURFMAR started, and this number has since decreased to under 200. However, during the same period, each month about 125 European S-AWS reported 1,700 observations per day from the EUMETNET area. This is 5 times more than in 2002. As of end 2018, there are over 150 European S-AWS units in operation, reporting on average over 2,000 observations per day in the EUMETNET area.

For different reasons, the data delivery delay of conventional VOS data remains longer than for S-AWS.

Early in the Operational Service, it was noted that the quality of pressure values reported by conventional VOS was below that of automated systems. The most common errors are due to a wrong correction of the height of the barometer above the waterline. Despite the set up of daily updated blacklist, the situation did not change much during the past years.

The S-AWS integrated fleet of VOS was an opportunity to try out various technologies. By the end of 2013, 10 BaTos and 18 BaRos AWS funded by the Operational Service were in operation (E-SURFMAR S-AWS fleet). The BaRos is normally a simple (autonomous) system reporting air pressure only (see picture here below). Moreover, three systems out of the 18 have been upgraded in BaRos+ AWS by Meteo France (air temperature, air humidity and wind measurements added). In 2013, several installations were done thanks to MOON members on ships plying in the Mediterranean Sea. This fleet served to demonstrate that the maintenance of a S-AWS network is not an easy job. Ships are often changing their programmes and may be sold or de-constructed without any lead time.

The procurement and development of a common solution S-AWS (EUCAWS) was started in 2013. After several prototypes, first series were ordered by several programme participants. As of 2019, over 30 operational EUCAWS units are reported data on the GTS, from ships recruited by several NMSes.

The development of an electronic logbook solution by KNMI was recognized as important early on, to improve data quality and quantity from conventional VOS. This has resulted in the development of several software packages: Turbowin, Turbowin+, Turboweb.

This development benefits from a new wind effective in 2019, with KNMI on the delivery side of the programme for the items that pertain the conventional VOS.

Metadata, monitoring & performance assessments

An online database was developed within the first years of the Operational Service to manage VOS metadata (WMO Pub47 format). It contains all VOS metadata available in the world (permanently updated), and is now operated by JCOMMOPS. With the announced transition to WIGOS, the programme participants have developped a new metadata standard, in collaboration with international partners, widening the scope to all ship-based observations (and not only VOS).

A set of quality control tools was developed by Meteo France to monitor E-SURFMAR observation networks. Mainly based on comparisons with model outputs, they may be actually used to monitor any surface marine observation platform in the world reporting onto the GTS.

Every month, the performances of the networks in matter of data availability, timeliness and quality, are assessed and compared to previous months and targets.

E-ASAP

0 Comments

OBSERVATIONS – E-ASAP

Objectives

The objective of the EUMETNET-ASAP (E-ASAP) Operational Service is to:

coordinate and optimize weather balloon observations (so called radiosoundings) over the data sparse ocean regions in the EUCOS area of interest. Most of these observations are performed by the crew members on board merchant vessels in regular service between Europe and North America.

  • "Coordination and optimisation of weather balloon observations over the ocean regions"

The tasks

– to design the E-ASAP Operational Service to meet the requirements, and in particular identify suitable merchant ships;

– to negotiate and conclude contracts in association with NMSs as appropriate with the shipping companies;

– to procure the necessary equipment or reimburse NMSs for the procurements;

– to ensure proper installation, training and logistics for the supply of consumables;

– to establish means of communication, insertion on the GTS and monitoring of performance;

– to liaise with the other components of the EUCOS programme and with the ASAP Task Team of the WMO.

The requirements

A. To deliver 3900 radiosoundings (from 18 stations) onto the Global Telecommunication System (GTS) and to make the data available to all National Meteorological Services (NMSs) for their weather forecast.

B. To optimize the overall system regarding efficiency of sounding operations and distribution of sounding data.

C. To contribute to the World Weather Watch of WMO through a limited number of soundings produced outside the EUCOS area of interest.

The organisation

The current Programme phase will last until the end of 2023. The Deutscher Wetterdienst has been the Coordinating Member for the Operational E-ASAP since 2003. The Operational Service Manager is Mr Rudolf Krockauer.

Publications

Article published in the December 2009 issue of the periodical Seaways. Purpose of the Article is to promote E-ASAP in the seafarer’s community. Read the article.

In the RODEO Project, new Application Programming Interfaces (APIs) are being developed for MeteoAlarm. These APIs enable access to multi-hazard early warnings through cross-border queries and bulk downloads for archived warnings. The goal is to improve the sharing and accessibility of warnings by integrating these capabilities into MeteoAlarm, including Near-Real-Time, Archived Warning, and Storm Name APIs. 

The CBCF is a collaborative forecast that provides EUROCONTROL’s Network Manager (NM), participating Air Navigation Service Providers (ANSPs), and other aviation stakeholders with strategic planning information about convective weather across European airspace. NM and the attached ATM-units use this information to coordinate with impacted Air Traffic Control Centres (ACCs) across Europe to minimise flight delays and improve aviation safety. The EUMETNET CBCF module comprises:

- the operational framework to produce a collaborative weather chart 
- the organisational environment enabling the production and development of the forecast service in line with users’ requirements  
- the designation of roles, responsibilities and interfaces amongst all stakeholders

CBCF participating MET ANSPs

CBCF domain in 2025

The eGAFOR forecast (eGAFOR Viewer) supports private pilots in central and south-eastern Europe with a uniform, harmonised, probabilistic, graphical, colour-coded Low-Level Forecast (LLF) for flights following visual flight rules. The service includes the assessment of the impact of the meteorological phenomena on flight routes.

The MET ANSPs participating in eGAFOR are:

- ARSO (Slovenia) 
- BHANSA (Bosnia and Herzegovina) 
- CCL (Croatia) 
- HungaroMet (Hungary) 
- ROMATSA (Romania) 
- SHMÚ (Slovakia) 
- SMATSA (Serbia and Montenegro) 
- BULATSA (Bulgaria) 

EUROCONTROL’s Network Manager (NM) is designated by Single European Sky (SES) legislation to manage the European airspace, linking together the elements of the European Air Traffic Management (ATM) system. Focusing on the performance of the European network, NM ensures that flights reach their destination safely, on time, with the least possible impact on the environment, and in a cost-efficient manner.

EUMETNET regularly liaises with the Network Manager on a wide range of aviation meteorological topics, with the long-term goal of delivering a consistent network view of the weather conditions affecting the network at airport, regional and continental scales. This work requires proactive coordination between the European MET ANSPs and collaborative efforts with EUROCONTROL and the European Union Aviation Safety Agency (EASA) to work towards the vision of a better-connected Europe under the SES. 

The E-AI programme will enhance the value of earth observations, gridded observational datasets, model fields and further datasets by making them AI-ready. The goal is to define and prepare a collection of datasets and develop appropriate interfaces and tools to make these data easily available for development, retraining, and operational use of AI/ML methods. Image sources: ESA (European Space Agency), EUMETSAT, DWD, Reinhardt et al. (https://doi.org/10.1175/AIES-D-22-0025.1) published under CC BY-SA 3.0 IGO

The SESAR (Single European Sky ATM Research) programme is one of the most ambitious research and development projects that the European Union has launched. The programme is the technological and operational dimension of the Single European Sky (SES) initiative to meet future capacity and air safety needs. Coordination on cross-border digital services is a key component of the SESAR programme, and meteorology is a key factor in enabling System Wide Information Management (SWIM) services to be delivered to all aviation stakeholders. 
EUMETNET supports the deployment of new pan-European harmonised SWIM products. You can register and gain access to these new MET SWIM Services via the SWIM Registry. In addition, EUMETNET and the ASP are helping participating MET ANSPs comply with the Common Project Regulation, which mandates the development and issuance of SWIM services. 

Why do we need a phenological database?  
Phenology – the timing of natural events in the life cycles of animals and plants – is perhaps the simplest process to track changes in the ecology of species in response to climate change (IPCC 2007). In most European countries, different governmental and non-governmental organisations have routinely carried out phenological observations for more than 50 years following different observation guidelines. Having the phenological data spread over many network operators made access difficult and hampered large-scale studies.
 
How does it work? 
The main objective of EUMETNET’s phenology network (PEP725) is to build and maintain a European-wide phenological database with open, unrestricted data access for science, research and education. So far, 27 European meteorological services and seven partners from different phenological network operators have joined PEP725. Open data access advertises the PEP725 dataset for the climate impact community and encourages scientific work based on it.

The PEP725 database is regularly updated with new data provided by EUMETNET members and their partners. The National Meteorological Service of Austria (GeoSphere Austria) manages the PEP725 database, which is freely available for education and research. Downloads and requests for data, as well as the number of peer-reviewed publications based on the PEP725 dataset, have been increasing steadily.  
Phenological data may be downloaded directly from the PEP725 home page (www.pep725.eu).

Who’s in charge? 
The PEP725 database is maintained and developed by the NMS of Austria (GeoSphere Austria).

PEP725 Module Manager: Hans Ressl (GeoSphere Austria) 
Email address: hans.ressl[at]geosphere.at  

MeteoGate Community components are needed to deliver shared capabilities, e.g. a data catalogue or access management. They will be established and operated by EUMETNET or its members and useable by data publishers and consumers inside and outside the hydro-meteorological community. 

1- A shared Data Catalogue defining and describing data assets and data collections, indexed, linked, and searchable to support data discovery and usage.

2- A Message Broker with a subscription service for notifications about the updates to both discovery metadata and the data.

3- Identity & Access management to control user and system access to platforms and platform services.

4- API management providing the interface between data consumers and underlying data stores, enabling managed access and usage of data and data products.

5- An Insights service reporting on data discovery and publication transactions for Data Publishers to derive management information.  

1- MeteoGate will enable the sharing of hydrological and meteorological data holdings both within the European Meteorological Infrastructure (EMI) and between the EMI and external stakeholders (global WMO community, public and private sector bodies, research institutions, citizens, etc.). The MeteoGate System will be part of the WMO Information System and will implement the WIS 2.0 principles.

2- The initial scope of MeteoGate includes sharing the following categories of data: Core Data (WMO Unified Data Policy), Meteorological High-Value Data (EU Regulation 2019/1024), and Data for Official Duty1. The MeteoGate System will be extensible so that additional functions can be incorporated as user requirements emerge.

3- MeteoGate will enable data sharing in a manner that is compliant with national and international legislation, regulation, and policy commonly applicable to the EMI, with priority given to obligatory requirements.

4- MeteoGate will support the data-sharing policies commonly used within the EMI, including but not limited to free and open data exchange. 

5- MeteoGate will neither affect ownership of shared data holdings nor impose additional conditions on data sharing.

6- The ownership, origin and license / usage terms of data holdings shared via MeteoGate will be visible to all stakeholders.

7- Policies and technical standards ensuring interoperability and consistency of operation among components of the MeteoGate will be mutually agreed and maintained by European NMHSs, EUMETSAT and ECMWF under the auspices of EUMETNET.

8- MeteoGate will be comprised of multiple components (e.g. data sharing platforms and systems), each owned and operated by constituents of the EMI and conforming with the mutually agreed policies and technical standards. Providers of MeteoGate components are encouraged to develop and/or operate them in a manner that supports the community. MeteoGate components may form part of national data-sharing infrastructures and vice versa.

9- MeteoGate will build upon existing data-sharing infrastructures, incorporating them when they conform to the mutually agreed policies and standards. MeteoGate will undergo continuous development as needs arise in the EMI.

10- MeteoGate will provide access to data holdings in-situ where local capability exists to do so. Moving data to a remote system only to support data sharing should be avoided.

11- MeteoGate will have a single catalogue describing all its data holdings and will provide mechanisms to enable users to search for the data they need. MeteoGate will make metadata contribution to the catalogue easy; aiming to avoid duplicate effort where data providers contribute to multiple data sharing initiatives. 

First meteorological data from aircrafts were taken in the early beginning of aircraft era. Following development of the concept for transmitting aircraft temperature and wind information to the ground in real-time by the Australian Bureau of Meteorology in the 1980’s, Europena National Met Services (NMHS) started developing their own individual AMDAR Programmes with their National carriers. Each NMHS was then responsible for data insertion to the GTS.

Initial airlines and start dates:

KLM (1993)Air France (1995)British Airways (1998)SAS (1998)Lufthansa (1999)

Met Office (UK) developed an automated data processing system to handle its British Airways data and so the opportunity arose to provide a single processing system for all European AMDAR data.

The European operational network was therefore established in June 2009 by the Met Office with 10 National Met Services (EUMETNET Members) agreeing to contribute and this Programme “Pilot Phase” extended to 2002.

The management team The Management team (Operational Service Manager and Technical Co-ordinator) are both full-time employees of the Met Office that reside within the Operations and Services Directorate of the Met Office; within the Observations programme that also provides the necessary administrative support and back-up.

“Early Warnings for All is a groundbreaking initiative to ensure that everyone on Earth is protected from hazardous weather, water, or climate events through life-saving early warning systems by the end of 2027."

The EMMA Programme supports these activities within the WMO Regional Association VI (Europe) by providing life-saving multi-hazard early warnings to the public across 38 European countries, with the potential to extend its capacities to other countries as the initiative progresses. 

The figure below shows the active GNSS stations currently providing data to E-GVap

In E-GVap, we aim to densify the network of GNSS receivers, providing us with valuable ZTD data. Several EUMETNET members run global weather forecasting models; for that reason,  data from outside Europe is also important. 

The MeteoAlarm Feeds provide a thorough summary of active multi-hazard early warnings, aggregated according to each NMS contributing to MeteoAlarm. Subscriptions to Atom and RSS Feeds are easy to access.

Information necessary for redistributing warnings from the contributing NMSs is accessible in the Redistribution Hub on the MeteoAlarm Website. It includes the MeteoAlarm Redistribution Guide, the MeteoAlarm Common Alerting Protocol (CAP) Profile, the Service Level Agreements (SLAs), and other relevant documentation. 

38 European National Meteorological Services contribute to the consistent visualisation of weather awareness information, thereby ensuring coherent interpretation of multi-hazard early warnings throughout Europe. 
Visit the MeteoAlarm Website for the latest weather-related awareness situation and further information. 

Several international meteorological organisations collaborated on a research project examining nowcasting capabilities and Early Warning Systems across different global regions. Working groups from the World Meteorological Organization's World Weather Research Programme and EUMETNET's Nowcasting module led this initiative.

More details can be found here: https://wwrp-nowcastingcapabilities.com/  

Bojinski S, Blaauboer D, Calbet X, de Coning E, Debie F, Montmerle T, Nietosvaara V, Norman K, Banon L, Schmid F, Strelec Mahovic N, Wapler K, 2023: Review: Towards Nowcasting in Europe in 2030, Meteorological Applications, https://doi.org/10.1002/met.2124  
 
Special Issue in Meteorologische Zeitschrift, Development and Application of Seamless Prediction Systems 
Part I: https://www.schweizerbart.de/papers/metz/list/29#issue3
Part II: https://www.schweizerbart.de/papers/metz/list/29#issue4  
 
Sivle A, Agersten S, Schmid F, Simon A, 2022: Use and perception of weather forecast information across Europe, Meteorological Applications, https://doi.org/10.1002/met.2053
 
Schmid F, Wang Y, Harou A, 2019: Nowcasting Guidelines - A summary, WMO Bulletin 68(2), 63-68; https://library.wmo.int/viewer/38575/?offset=#page=3&viewer=picture&o=bookmarks&n=0&q=  
 
WMO in cooperation with E-NWC, 2017: Guidelines for Nowcasting Techniques, WMO Nr. 1198,  
https://library.wmo.int/records/item/55666-guidelines-for-nowcasting-techniques  

Base dataset – Low-resolution gridded data 
The benchmark base dataset is a low-resolution gridded dataset that covers the European area from 36 to 67° in latitude and from -6 to 17° of longitude, with grid spacing of 0.25°x0.25°.

The benchmark dataset consists of 47 fields, with at least seven requiring post-processing. It includes daily forecasts at midnight, which feature ensemble, control, and high-resolution ECMWF runs, as well as reforecasts twice a week and hourly analysis data. The training set covers 2017 and 2018, while the test set is for 2019. The total size of the gridded benchmark is about 6 terabytes (TB), with the training set being 4.3 TB and the test set 1.6 TB. This dataset provides a solid basis for evaluating and comparing different post-processing methods used by National Meteorological Services.

More details about the base dataset can be found at https://eupp-benchmark.github.io/EUPPBench-doc/files/base_datasets.html.

EUPPBench datasets 
In addition to the base dataset, specific datasets for statistical and machine learning over a smaller domain have been designed. The EUPPBench datasets are available over a smaller area within Europe, stored in Zarr format for easy access. The forecasts and observations datasets are already paired together, providing analysis-ready data for post-processing benchmarking purposes. 

The EUPPBench datasets also include station data all over the selected domain and ECMWF forecasts and reforecasts from the nearest grid point.  
With these datasets, the first benchmark of several post-processing methods was conducted and published in Earth System Science Data (ESSD). More details on the EUPPBench datasets and this first benchmark can be found at https://essd.copernicus.org/articles/15/2635/2023/.

An example of deterministic IFS forecast for 100m u wind and the corresponding gridded observations in the EUPPBench dataset.

The benchmark is a key deliverable of the EUMETNET Post-Processing module, designed to provide high-quality benchmark datasets and infrastructures for comparing the various methods used to post-process forecasts in National Meteorological Services.

The benchmark is composed of two components: gridded post-processing, which requires gridded observations, forecasts, and reforecasts; and station-based post-processing, which requires station observations and forecasts and reforecasts at the nearest point.

For more information on the benchmark activities of the PP module, you can visit our website:
https://eupp-benchmark.github.io

Technical details and relevant codes are developed on GitHub:
https://github.com/orgs/EUPP-benchmark 

Between 2019 and 2023, the OPERA data centre (ODYSSEY) was gradually upgraded with three new production lines (CUMULUS/STRATUS, CIRRUS, and NIMBUS).

Figure: The schematic structure of the new OPERA data production. 

The three new production lines are:

CUMULUS/STRATUS, a real-time data hub providing the incoming data to members in close to real-time for their own processing (e.g. production of regional composites or NWP assimilation) and to the other two production lines (CIRRUS and NIMBUS). This production line has been operational since mid-2021. 
CIRRUS produces a 5-minute instantaneous maximum reflectivity composite (dBZ) for current weather, severe weather alerts and aviation needs. It replaced the old ODYSSEY maximum reflectivity composite with improved spatial (now with 1 km gridding) and temporal resolution (from 15 minutes to 5 minutes).  The production has been operational since early 2024. Documentation on the CIRRUS maximum reflectivity product and its differences compared to the ODYSSEY maximum reflectivity product can be found here:

–       OPERA_Max Reflectivity_Product Sheet_Ed-2.0.pdf
–       OPERA5_Report_Cirrus-vs-Odyssey_Ed-2.0.pdf

NIMBUS produces the quality-controlled products centrally: instantaneous rain rate (mm/h) and 1-hour accumulation (mm) composites, wind profiles (expected in late 2025), and the quality-controlled volume data for NWP assimilation. It replaces the old ODYSSEY production for the above-mentioned products. The NIMBUS production has been operational since mid-2024. Documentation regarding the NIMBUS composites and their differences compared to the corresponding ODYSSEY can be found here:

–      NIMBUS_datasheet_composites_1.0_13062024.pdf 
–      NIMBUS_composite_vs_ODYSSEY_1.0_19062024.pdf

OPERA support can be reached by email at support.opera[at]eumetnet.eu. Responses from the service desk are provided on a best-effort basis.

Access to data 
EUMETNET members may use the composites for their official duties without a separate license. Their Numerical Weather Prediction (NWP) modelers obtain the quality-controlled volume data directly from the NIMBUS production line.

The OPERA products are also available under license to Third parties:

- For national meteorological services not participating in the OPERA programme that want to use the products for their official duties, contact info[at]eumetnet.eu
- For a research and education license, contact info[at]eumetnet.eu. 
- For a license to exploit the OPERA products commercially, contact one of the EUMETNET members’ contact points (https://www.ecomet.eu/contact/members) or send an email to the EUMETNET Secretariat using the email address: info[at]eumetnet.eu 

What is E-AMDAR
E-AMDAR is EUMETNETs contribution to the World Meteorological Organization (WMO) Aircraft Meteorological Data Relay (AMDAR) observing system. E-AMDAR facilitates the fully automated collection and transmission of weather observations from commercial aircraft. The E-AMDAR programme is an integrated component of the WMO Global Observing System (GOS) of the World Weather Watch (WWW) Programme . The system is operated by EUMETNET Member NMHS in collaboration and cooperation with partner airlines.

The AMDAR Observing System
The figure below provides a general depiction of the AMDAR system in which onboard sensors, computers and communications systems collect, process, format and transmit the data to ground stations via satellite and VHF radio links. The transmission of this data is most often performed by the aircraft’s ACARS (Aircraft Communications Addressing and Reporting System) system. Once on the ground, the data is then relayed to the global network of national meteorological services and other authorised users.

Currently 14 airlines are participating in E-ABO, more than 1000 planes are equipped for transmitting the meteorological data.

http://www.planespotters.net/Airline/Country

In the Implementing Regulation of the revised Open Data Directive, the European Union has defined a set of High-Value Datasets (HVDs). These are data that have high value for the community. One of the sets defined by the Regulation concerns meteorological data: weather observations, climate time series, warnings, weather radar data and numerical weather prediction (NWP) data.

Following the regulation, these data should be available free of charge, under an open license, in a machine-readable format using Application Programming Interface (API), and bulk downloadable.

Further information on EUMETNET’s response to the High-Value Datasets Regulation can be found under the RODEO page

Over the years, the OPERA community has produced an impressive library of documents, recommendations, and definitions. Many of the early technical documents are now more of historical value.

Selected publications of OPERA 6 (2024 -2028) 
ODIM version 2.41 (2024 -for older versions, see software documentation) 
 
Selected publications of OPERA 5 (2019-2023)

- Best practices for calibration and monitoring 25 October 2020 
- ODIM version 2.4 (2021) 
- OPERA-4: On the coexistence of weather radars and wind turbines, 25 February 2022

Selected publications of OPERA 4 (2013-2018)

- OPERA the Radar Project, article in Atmosphere, 12 June 2019 (https://www.mdpi.com/478188) 
- Frequently asked questions about radars, 26 January 2016 
- Best practices for calibration and monitoring 19 January 2019 
- ODIM version 2.3 (9 January 2019) 
- BUFR format and graphical format for polar volume data submitted to and composites produced by the OPERA, version dated 12 March 2012 
- The Operational Weather Radar Network in Europe – article in Bull.Am.Met.Soc. 2014 (https://journals.ametsoc.org/view/journals/bams/95/6/bams-d-12-00216.1.xml
- The Threat to Weather Radars by Wireless Technology – article in Bull.Am.Met.Soc. July 2016 (https://journals.ametsoc.org/view/journals/bams/97/7/bams-d-15-00048.1.xml
- Maintenance keeps radars running – article in Bull.Am.Met.Soc. 2017 (https://journals.ametsoc.org/view/journals/bams/98/9/bams-d-16-0095.1.xml#:~:text=Most%20radars%20are%20equipped%20with,%2C%20the%20emergency%20power%20generator).
- Quality of the composites – report of a study 
- Monitoring rain rates – report of a study 
- Daily convective precipitation – report of a study 
- Cost-benefit of dual-pol exchange – report of survey in 2016 
- Improvement of rain rates using water phase (snow or rain) – report of a study

Selected Deliverables of OPERA 3 (2007-2012)

- Status of use of polarimetric C and S band radars (2012) 
- Status of use of polarimetric X band radars (2012) 
- Radar site selection and protection (2010) 
- Impact study of radar observations by wind turbines (2010) 
- Statement on wind turbines (2010) 
- Statement of the OPERA group on processing RLAN interferences (2009) 
- Recommendation on coexistence with 5 GHz RLAN (2008) 
- Harmonised production practices for volume data, low-level reflectivity, and wind profiles (2008) 

Meteo-France has developed a set of quality control tools to monitor the status of the E-SurfMar observation networks: https://esurfmar.meteo.fr/qctools/. Primarily based on comparisons of observations with model results, these tools may be used to monitor any surface marine observation platform in the world that reports data onto the GTS.Every month, the performances of the networks in matters of data availability, timeliness, and quality are assessed and compared to previous months and targets. 

Between 2019 and 2023, the OPERA data centre (ODYSSEY) was gradually upgraded with three new production lines (CUMULUS/STRATUS, CIRRUS, and NIMBUS).

Figure: The schematic structure of the new OPERA data production. 

The three new production lines are:

CUMULUS/STRATUS, a real-time data hub providing the incoming data to members in close to real-time for their own processing (e.g. production of regional composites or NWP assimilation) and to the other two production lines (CIRRUS and NIMBUS). This production line has been operational since mid-2021. 
CIRRUS produces a 5-minute instantaneous maximum reflectivity composite (dBZ) for current weather, severe weather alerts and aviation needs. It replaced the old ODYSSEY maximum reflectivity composite with improved spatial (now with 1 km gridding) and temporal resolution (from 15 minutes to 5 minutes).  The production has been operational since early 2024. Documentation on the CIRRUS maximum reflectivity product and its differences compared to the ODYSSEY maximum reflectivity product can be found here:

–       OPERA_Max Reflectivity_Product Sheet_Ed-2.0.pdf
–       OPERA5_Report_Cirrus-vs-Odyssey_Ed-2.0.pdf

NIMBUS produces the quality-controlled products centrally: instantaneous rain rate (mm/h) and 1-hour accumulation (mm) composites, wind profiles (expected in late 2025), and the quality-controlled volume data for NWP assimilation. It replaces the old ODYSSEY production for the above-mentioned products. The NIMBUS production has been operational since mid-2024. Documentation regarding the NIMBUS composites and their differences compared to the corresponding ODYSSEY can be found here:

–      NIMBUS_datasheet_composites_1.0_13062024.pdf 
–      NIMBUS_composite_vs_ODYSSEY_1.0_19062024.pdf

OPERA support can be reached by email at support.opera[at]eumetnet.eu. Responses from the service desk are provided on a best-effort basis.

Access to data 
EUMETNET members may use the composites for their official duties without a separate license. Their Numerical Weather Prediction (NWP) modelers obtain the quality-controlled volume data directly from the NIMBUS production line.

The OPERA products are also available under license to Third parties:

- For national meteorological services not participating in the OPERA programme that want to use the products for their official duties, contact info[at]eumetnet.eu
- For a research and education license, contact info[at]eumetnet.eu. 
- For a license to exploit the OPERA products commercially, contact one of the EUMETNET members’ contact points (https://www.ecomet.eu/contact/members) or send an email to the EUMETNET Secretariat using the email address: info[at]eumetnet.eu 

E-Profile's wind network consists of about 30 radar wind profilers, about 100 weather radars providing wind profiles and new Doppler lidars. All radars send processed vertical wind profile data to E-Profile. According to the operating frequency of the radar, the derived wind profiles cover the atmospheric boundary layer (up to about 3 km), full troposphere (up to about 12 km), or troposphere and lower stratosphere (up to about 20 km). Lidar data are processed centrally using the Doppler lidar toolbox developed by the National Meteorological Service of Germany (DWD). The range of the Doppler lidars depends on the presence of aerosols and is typically limited to the atmospheric boundary layer. 
E-Profile maintains a list of recommended stations for data assimilation into numerical weather prediction models based on the EUCOS (EUMETNET Composite Observing System) monitoring results and considering data quality and timeliness. 
Please contact e-profile[at]meteoswiss.ch to get the current list of the E-Profile stations.


Wind profiler at Lindenberg, Germany. 

Data download (CEDA archive, registration required):  
Wind profiler network

The E-GVap programme exemplifies the synergy between geodesy and meteorology. Through partnerships with geodetic organisations such as EUREF (the Reference Frame Sub-Commission for Europe of the International Association of Geodesy (IAG)), EUPOS (European Position Determination System) , and EPOS (European Plate Observing System), EUMETNET has access to crucial GNSS data.

Geodesists primarily use GNSS receivers for precise positioning and view atmospheric delay—particularly from water vapour—as “noise” to be eliminated. In contrast, meteorologists recognize this "noise" as valuable information about atmospheric water vapour content. Zenith Total Delay (ZTD) estimates provided by geodetic institutions play a key role in improving positioning accuracy. This atmospheric delay, which geodesists seek to remove, contains data that is essential for some meteorological applications.

This collaboration allows both fields to benefit, advancing their respective goals while contributing to a broader understanding of atmospheric processes.

The participating GNSS analysis centres are:

- AUT Aristotle University of Thessaloniki, Greece 
- ASI e-geos/Telespazio, Italy 
- BKG Federal Agency for Cartography and geodesy 
- BMEG Budapest University of Technology and Economics, Hungary 
- CONH UCAR, USA 
- GA01 Geoscience, Australia 
- GFZ Helmholtz Centre Potsdam, GFZ German Research Center for Geosciences 
- GOPE Geodetic Observatory Pecny, Czech Republic 
- IGE Instituto Geografica National, Spain 
- IMO Icelandic Met Office, Iceland 
- KNMI Royal Meteorological Institute of the Netherlands 
- LPT SwissTope, Switzerland 
- METO UK Met Office 
- NGA Lantmateriet (Swedish Mapping, Cadestre and Land Regi. Authority), Sweden 
- ROB Royal Observatory of Belgium 
- SGN Institut Geographique National, France 
- SGOB Satellite Geodetic Observatory, IGCRS + Technical Univ. Budapest, Hungary 
- TUWN Technical University Vienna, Austria 
- UL01 Univ. of Luxembourg, Faculty of Science and Communication, Luxembourg 
- WLIT Lithuania, set up and run by WUEL 
- WTWN Taiwan, set up and run by WUEL 
- WUEL Wroclaw University + Institute of Geodesy and Geoinformatics, Poland 
- WUHN GNSS research Center, Wuhan University, China 

AutoPollen programme participants come from 25 institutes and associations from 22 countries that are either EUMETNET members or cooperating third parties. An extensive list of participants, as well as a list of publications and links to projects and networks across Europe, can be found on the AutoPollen website along with relevant data.

Furthermore, the AutoPollen programme collaborates with several European-level projects and organisations, including: Horizon Europe Project SYLVA (A SYstem for ReaL-Time ObserVation of Aeroallergens), Copernicus Atmospheric Monitoring Services (CAMS), the COST Action ADOPT (New Approaches in Detection of Pathogens and Aeroallergens – CA18226), EURAMET on the BioAirMet project, and Working Group 39 of the European Normalisation Committee (CEN - Technical Committee 264). 

The coverage for the EUMETNET-derived data network from the European Meteorological Aircraft Derived Data Centre for a typical day is shown on the map below. This shows how tens of millions of observations are collected daily, with the highest concentrations indicated by the red colours.

Total Coverage
Number of derived obs in [0.5x0.5]° - 15/01/2025

La couverture du réseau AMDAR d'EUMETNET pour une journée type est illustrée sur la carte ci-dessous. Les tracés jaunes indiquent les observations prises en route, les tracés rouges et verts représentant les profils de montée et de descente des avions. 

Data Publishers such as National Meteorological Services (NMSs) will need to create and operate (potentially in collaboration) several MeteoGate Local components to exploit the system’s benefits. They can choose the level of maturity of the solutions they want to implement – from manual to fully automated. There are collaborative options that allow the reduction of the costs of developing Local components; most of them are needed for NMSs’ obligations towards WMO and its WIS2.0.

- Persistence to store and allow for shared data to be accessed through APIs 
- Data Processing in line with WMO regulations and MeteoGate Policies, Standards and Processes (PSPs) to standardise and productise data so that it can be shared using APIs 
- Local Broker to send change notifications to the WMO Global Broker of news and updates to discovery metadata and shared data  
- Metadata Management to create, publish and maintain the discovery and provenance metadata to share changes with the Global Discovery Catalogue. 
- Data Access to expose data to MeteoGate users using interactive APIs through the API Gateway 

MeteoGate Community components are needed to deliver shared capabilities, e.g. a data catalogue or access management. They will be established and operated by EUMETNET or its members and useable by data publishers and consumers inside and outside the hydro-meteorological community. 

1- A shared Data Catalogue defining and describing data assets and data collections, indexed, linked, and searchable to support data discovery and usage.

2- A Message Broker with a subscription service for notifications about the updates to both discovery metadata and the data.

3- Identity & Access management to control user and system access to platforms and platform services.

4- API management providing the interface between data consumers and underlying data stores, enabling managed access and usage of data and data products.

5- An Insights service reporting on data discovery and publication transactions for Data Publishers to derive management information.  

1- MeteoGate will enable the sharing of hydrological and meteorological data holdings both within the European Meteorological Infrastructure (EMI) and between the EMI and external stakeholders (global WMO community, public and private sector bodies, research institutions, citizens, etc.). The MeteoGate System will be part of the WMO Information System and will implement the WIS 2.0 principles.

2- The initial scope of MeteoGate includes sharing the following categories of data: Core Data (WMO Unified Data Policy), Meteorological High-Value Data (EU Regulation 2019/1024), and Data for Official Duty1. The MeteoGate System will be extensible so that additional functions can be incorporated as user requirements emerge.

3- MeteoGate will enable data sharing in a manner that is compliant with national and international legislation, regulation, and policy commonly applicable to the EMI, with priority given to obligatory requirements.

4- MeteoGate will support the data-sharing policies commonly used within the EMI, including but not limited to free and open data exchange. 

5- MeteoGate will neither affect ownership of shared data holdings nor impose additional conditions on data sharing.

6- The ownership, origin and license / usage terms of data holdings shared via MeteoGate will be visible to all stakeholders.

7- Policies and technical standards ensuring interoperability and consistency of operation among components of the MeteoGate will be mutually agreed and maintained by European NMHSs, EUMETSAT and ECMWF under the auspices of EUMETNET.

8- MeteoGate will be comprised of multiple components (e.g. data sharing platforms and systems), each owned and operated by constituents of the EMI and conforming with the mutually agreed policies and technical standards. Providers of MeteoGate components are encouraged to develop and/or operate them in a manner that supports the community. MeteoGate components may form part of national data-sharing infrastructures and vice versa.

9- MeteoGate will build upon existing data-sharing infrastructures, incorporating them when they conform to the mutually agreed policies and standards. MeteoGate will undergo continuous development as needs arise in the EMI.

10- MeteoGate will provide access to data holdings in-situ where local capability exists to do so. Moving data to a remote system only to support data sharing should be avoided.

11- MeteoGate will have a single catalogue describing all its data holdings and will provide mechanisms to enable users to search for the data they need. MeteoGate will make metadata contribution to the catalogue easy; aiming to avoid duplicate effort where data providers contribute to multiple data sharing initiatives. 

Over the year, the OPERA community has developed several software packages to exchange radar data from different sources and manufacturers.  
Data exchange in OPERA is currently conducted using files in the Hierarchical Data Format version 5 (HDF5), following the internally developed OPERA Data Information Model (ODIM). ODIM has been widely adopted and implemented both within and beyond the OPERA community, and it is continuously updated. 
Software documentation:

- ODIM version 2.41 (2024) 
- ODIM version 2.4 (2021) 
- ODIM version 2.3 (2019)  
- ODIM version 2.2 (2014) 
- ODIM version 2.1
- ODIM version 2.01

Example file of ODIM 2.4: T_PAZA41_C_LPMG_20241205100002.h5.gz 

The E-AI programme is structured in three modules: a) Data Curation, b) Analysis, Modelling and Post-Processing, and c) Products and Services. By working together on overarching Workflows, AI/ML can be used effectively across the entire value chain while also addressing necessary technical, administrative, and structural requirements. Moreover, the programme offers Communication and Training opportunities to ensure an efficient flow of information on AI/ML developments within and beyond the E-AI programme.


Voluntary Observing Ships (VOS) are a vital part of the global weather observation system, providing essential meteorological and oceanographic observations at sea. Weather stations managed by National Meteorological Services and installed on board VOS  typically record and transmit data on surface wind speed and direction, air temperature, humidity, sea surface temperature (SST), atmospheric sea level pressure (SLP), cloud characteristics, visibility, wave and swell parameters, and overall present weather status. The VOS data are crucial for real-time weather forecasting and historical climate studies, especially in data-sparse regions like the Arctic. They contribute significantly to our understanding of atmosphere-ocean interactions, which is essential for addressing global warming and improving long-range weather forecasts.

There are two main types of VOS: conventional VOS, where sailors make observations and record data in meteorological logbooks, and VOS with automated systems that use electronic logbooks for streamlined reporting.

The NMS of the Netherlands (KNMI) has developed the Turbowin software package to enhance data acquisition, quality and quantity from conventional VOS.

Turbowin+ software

 
The number of VOS with automated weather stations (AWS) has increased, resulting in more frequent marine observations, usually with hourly transmissions. In 2024, more than 265 operational AWS units have reported data on the Global Telecommunication System (GTS) from ships recruited by several NMSs. A common AWS, called EUCAWS, was developed in 2017 under E-SurfMar and has been installed by national meteorological services on several VOS since then.  
In 2022-2023, E-SurfMar developed a new mini automatic weather station for installation on board vessels. This mini station offers a wide range of possibilities for connecting sensors and sending messages. Power consumption is low, installation is easy, and its cost is low. This station is now operational and about ten have already been installed on European vessels.

Moored buoys are anchored at fixed locations and regularly collect observations from various atmospheric and oceanographic sensors. These buoys measure a wide range of parameters crucial for operational applications, including both meteorological and oceanographic data. The meteorological parameters typically measured by moored buoys are air temperature, humidity, atmospheric pressure, and wind speed and direction. Oceanographic measurements generally include sea surface temperature and, in some cases, ocean currents and salinity. Sea state (the general condition of the ocean surface with respect to wind waves and swell at a specific location and time), is also of significant interest for many applications.

Wave parameters are measured by tracking the buoy's displacement, assuming it responds to waves without affecting the measurement. Modern moored buoys transmit wave parameters and spectral data through the Global Telecommunication System (GTS). The quality of the data from these buoys is considered amongst the finest available from surface marine stations. These measurements are vital for weather forecasting, maritime safety and scientific research, whilst also serving as crucial reference points for calibrating and verifying satellite measurements and numerical atmospheric and ocean models. Moored buoys can be fitted with additional sensors to meet specific research or operational requirements. Some are capable of measuring parameters throughout the water column, which is the vertical section of water from surface to seabed. This provides valuable data on subsurface conditions at various depths, offering a comprehensive view of oceanic processes from top to bottom. 

More than 150 E-SurfMar drifting buoys are permanently operating in the EUMETNET Composite Observing System (EUCOS) area. E-SurfMar relies on partner institutions in The Netherlands, Portugal, UK, France, Italy, Germany, Canada and the United States to deploy and maintain the drifting buoy network.

Deployments are carried out using various vessels, including container ships, expedition sailboats, and racing yachts. Our goal is to optimise our networks for consistent spatial and temporal coverage. Drifting buoys, designed to track surface currents, have a hemispheric shape and include a holey sock drogue (sea anchor) at a standard depth of 15 metres below the surface. These buoys use GPS to measure their position and transmit surface air pressure and sea surface temperature data in real time via the Iridium satellite communication system. By analysing multiple reports from different positions, we can estimate near-surface ocean currents. The average operational lifespan of a drifting buoy is approximately 600 days. While sea surface temperature (SST) is important, we primarily focus on atmospheric surface pressure, as this parameter cannot be measured by satellites.

A drifting buoy with the drogue (credit Lagrangian drifting laboratory) 

OPERA maintains a database of radar metadata provided by members. It is divided into active radars and archived information (radars no longer part of OPERA).

Public information, location and details of the radars can be found here (Link: https://www.eumetnet.eu/wp-content/themes/aeron-child/observations-programme/current-activities/opera/database/OPERA_Database/index.html). 

Over the years, the OPERA community has produced an impressive library of documents, recommendations, and definitions. Many of the early technical documents are now more of historical value.

Selected publications of OPERA 6 (2024 -2028) 
ODIM version 2.41 (2024 -for older versions, see software documentation) 
 
Selected publications of OPERA 5 (2019-2023)

- Best practices for calibration and monitoring 25 October 2020 
- ODIM version 2.4 (2021) 
- OPERA-4: On the coexistence of weather radars and wind turbines, 25 February 2022

Selected publications of OPERA 4 (2013-2018)

- OPERA the Radar Project, article in Atmosphere, 12 June 2019 (https://www.mdpi.com/478188) 
- Frequently asked questions about radars, 26 January 2016 
- Best practices for calibration and monitoring 19 January 2019 
- ODIM version 2.3 (9 January 2019) 
- BUFR format and graphical format for polar volume data submitted to and composites produced by the OPERA, version dated 12 March 2012 
- The Operational Weather Radar Network in Europe – article in Bull.Am.Met.Soc. 2014 (https://journals.ametsoc.org/view/journals/bams/95/6/bams-d-12-00216.1.xml
- The Threat to Weather Radars by Wireless Technology – article in Bull.Am.Met.Soc. July 2016 (https://journals.ametsoc.org/view/journals/bams/97/7/bams-d-15-00048.1.xml
- Maintenance keeps radars running – article in Bull.Am.Met.Soc. 2017 (https://journals.ametsoc.org/view/journals/bams/98/9/bams-d-16-0095.1.xml#:~:text=Most%20radars%20are%20equipped%20with,%2C%20the%20emergency%20power%20generator).
- Quality of the composites – report of a study 
- Monitoring rain rates – report of a study 
- Daily convective precipitation – report of a study 
- Cost-benefit of dual-pol exchange – report of survey in 2016 
- Improvement of rain rates using water phase (snow or rain) – report of a study

Selected Deliverables of OPERA 3 (2007-2012)

- Status of use of polarimetric C and S band radars (2012) 
- Status of use of polarimetric X band radars (2012) 
- Radar site selection and protection (2010) 
- Impact study of radar observations by wind turbines (2010) 
- Statement on wind turbines (2010) 
- Statement of the OPERA group on processing RLAN interferences (2009) 
- Recommendation on coexistence with 5 GHz RLAN (2008) 
- Harmonised production practices for volume data, low-level reflectivity, and wind profiles (2008) 

Over the year, the OPERA community has developed several software packages to exchange radar data from different sources and manufacturers.  
Data exchange in OPERA is currently conducted using files in the Hierarchical Data Format version 5 (HDF5), following the internally developed OPERA Data Information Model (ODIM). ODIM has been widely adopted and implemented both within and beyond the OPERA community, and it is continuously updated. 
Software documentation:

- ODIM version 2.41 (2024) 
- ODIM version 2.4 (2021) 
- ODIM version 2.3 (2019)  
- ODIM version 2.2 (2014) 
- ODIM version 2.1
- ODIM version 2.01

Example file of ODIM 2.4: T_PAZA41_C_LPMG_20241205100002.h5.gz 

Between 2019 and 2023, the OPERA data centre (ODYSSEY) was gradually upgraded with three new production lines (CUMULUS/STRATUS, CIRRUS, and NIMBUS).

Figure: The schematic structure of the new OPERA data production. 

The three new production lines are:

CUMULUS/STRATUS, a real-time data hub providing the incoming data to members in close to real-time for their own processing (e.g. production of regional composites or NWP assimilation) and to the other two production lines (CIRRUS and NIMBUS). This production line has been operational since mid-2021. 
CIRRUS produces a 5-minute instantaneous maximum reflectivity composite (dBZ) for current weather, severe weather alerts and aviation needs. It replaced the old ODYSSEY maximum reflectivity composite with improved spatial (now with 1 km gridding) and temporal resolution (from 15 minutes to 5 minutes).  The production has been operational since early 2024. Documentation on the CIRRUS maximum reflectivity product and its differences compared to the ODYSSEY maximum reflectivity product can be found here:

–       OPERA_Max Reflectivity_Product Sheet_Ed-2.0.pdf
–       OPERA5_Report_Cirrus-vs-Odyssey_Ed-2.0.pdf

NIMBUS produces the quality-controlled products centrally: instantaneous rain rate (mm/h) and 1-hour accumulation (mm) composites, wind profiles (expected in late 2025), and the quality-controlled volume data for NWP assimilation. It replaces the old ODYSSEY production for the above-mentioned products. The NIMBUS production has been operational since mid-2024. Documentation regarding the NIMBUS composites and their differences compared to the corresponding ODYSSEY can be found here:

–      NIMBUS_datasheet_composites_1.0_13062024.pdf 
–      NIMBUS_composite_vs_ODYSSEY_1.0_19062024.pdf

OPERA support can be reached by email at support.opera[at]eumetnet.eu. Responses from the service desk are provided on a best-effort basis.

Access to data 
EUMETNET members may use the composites for their official duties without a separate license. Their Numerical Weather Prediction (NWP) modelers obtain the quality-controlled volume data directly from the NIMBUS production line.

The OPERA products are also available under license to Third parties:

- For national meteorological services not participating in the OPERA programme that want to use the products for their official duties, contact info[at]eumetnet.eu
- For a research and education license, contact info[at]eumetnet.eu. 
- For a license to exploit the OPERA products commercially, contact one of the EUMETNET members’ contact points (https://www.ecomet.eu/contact/members) or send an email to the EUMETNET Secretariat using the email address: info[at]eumetnet.eu 

Microwave radiometers are passive instruments that measure the natural radiation from the atmosphere. These radiation measurements are presented as “brightness temperatures” in Kelvin units. We use the TROPOe software suite to convert the brightness temperatures into vertical profiles of temperature and humidity. These profiles typically cover the first 2 km of the atmosphere. Both brightness temperatures and profiles are disseminated via the Global Telecommunication System (GTS). In the future, they will also be disseminated via the WIGOS Information System (WIS).

Microwave radiometers at Payerne, Switzerland. 

The aerosol and cloud network consists of more than 450 automatic lidars (light detection and ranging sensors) and ceilometers. The main purpose of the latter is to measure the height of the cloud base, which is important for planning safe navigation in aviation and understanding atmospheric stability and convection that can result in severe weather or favourable conditions for high-air-pollution episodes. The diverse applicability of ceilometer data explains the high density of the ceilometer network. The automatic lidars and ceilometers are centrally calibrated to create profiles showing how much light is scattered back by particles. That light is related to the size and concentration of particles in the atmosphere. Appropriate calibration techniques enable the estimation of the mass concentration of aerosols and their impact on the radiative transfer in the atmosphere. 
An interactive interface to analyse advanced aerosol properties can be found here: https://vprofiles.met.no/.  
Data download (CEDA archive, registration required):  
Aerosol and cloud profiler network
 

Ceilometer and automatic lidar at Hohenpeissenberg, Germany. 

...